Fig. A.1.
Download original image
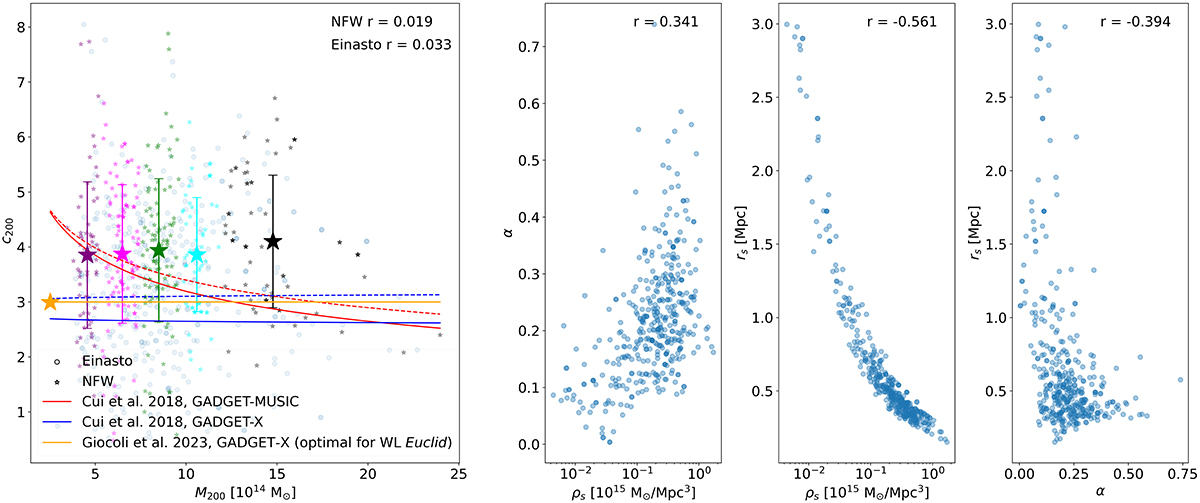
Best-fit values of the posterior distributions of NFW (left) and Einasto (right) parameters. Each point corresponds to one projection of one cluster. We give the Pearson correlation coefficients for the parameters presented in each panel. In the left panel the big stars show the mean concentration and the standard deviation in different mass bins. Blue and red lines show the concentration-mass relations for GADGET-X and GADGET-MUSIC simulations obtained in Cui et al. (2018) accounting for different radial ranges: with solid lines considering data above 0.05 × R200 and with dashed lines the results considering data above 34h−1 kpc. The horizontal orange line at c200 = 3 in the left panel represents the best concentration value obtained in Euclid Collaboration (2024) to reconstruct unbiased masses. For comparison, in the left panel we also plot the M200 and c200 = R200/rs obtained for the Einasto best-fits.
Current usage metrics show cumulative count of Article Views (full-text article views including HTML views, PDF and ePub downloads, according to the available data) and Abstracts Views on Vision4Press platform.
Data correspond to usage on the plateform after 2015. The current usage metrics is available 48-96 hours after online publication and is updated daily on week days.
Initial download of the metrics may take a while.