Fig. 12.
Download original image
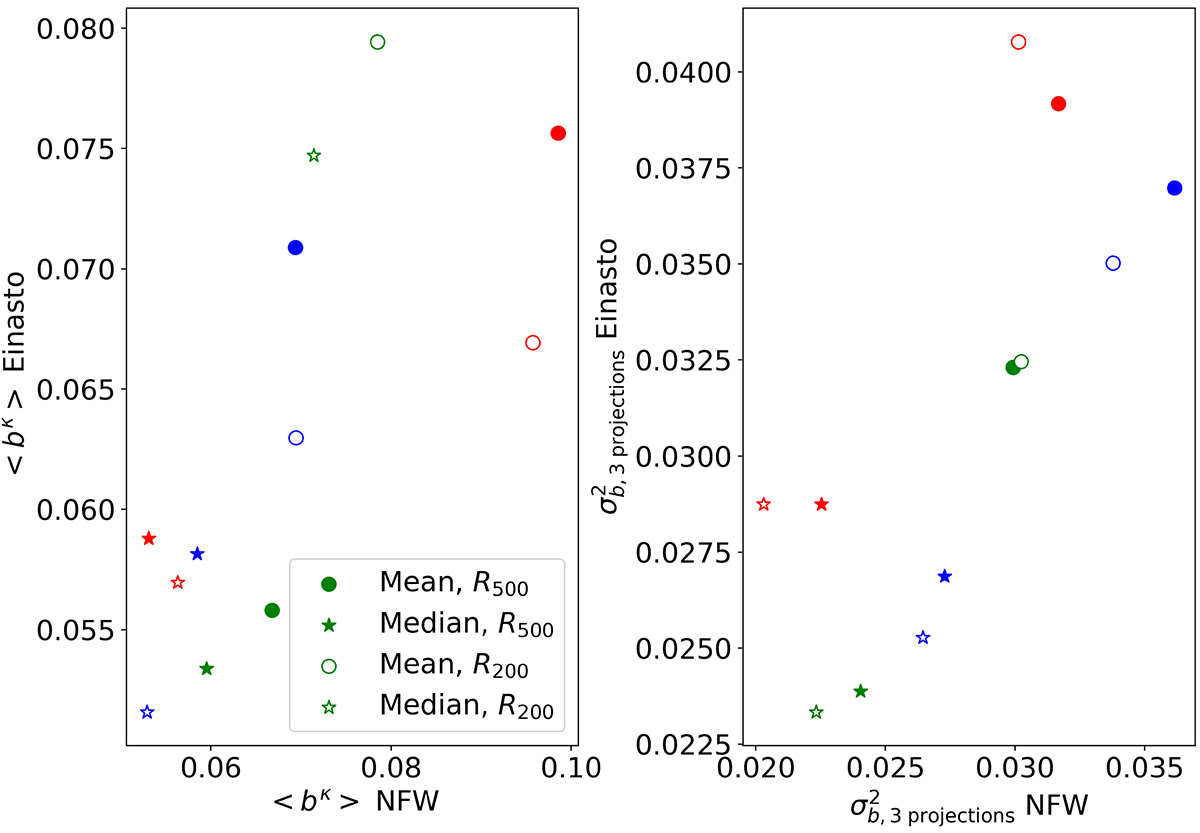
Summarised bias properties depending on the dynamical state of clusters within R200 (empty) and R500 (filled). Left: mean (circle) and median (star) of the mean biases of each type of cluster. Right: mean and median of the ![]() for all the clusters of each type. We show in green, blue, and red the results for relaxed, intermediate, and disturbed clusters, respectively.
for all the clusters of each type. We show in green, blue, and red the results for relaxed, intermediate, and disturbed clusters, respectively.
Current usage metrics show cumulative count of Article Views (full-text article views including HTML views, PDF and ePub downloads, according to the available data) and Abstracts Views on Vision4Press platform.
Data correspond to usage on the plateform after 2015. The current usage metrics is available 48-96 hours after online publication and is updated daily on week days.
Initial download of the metrics may take a while.