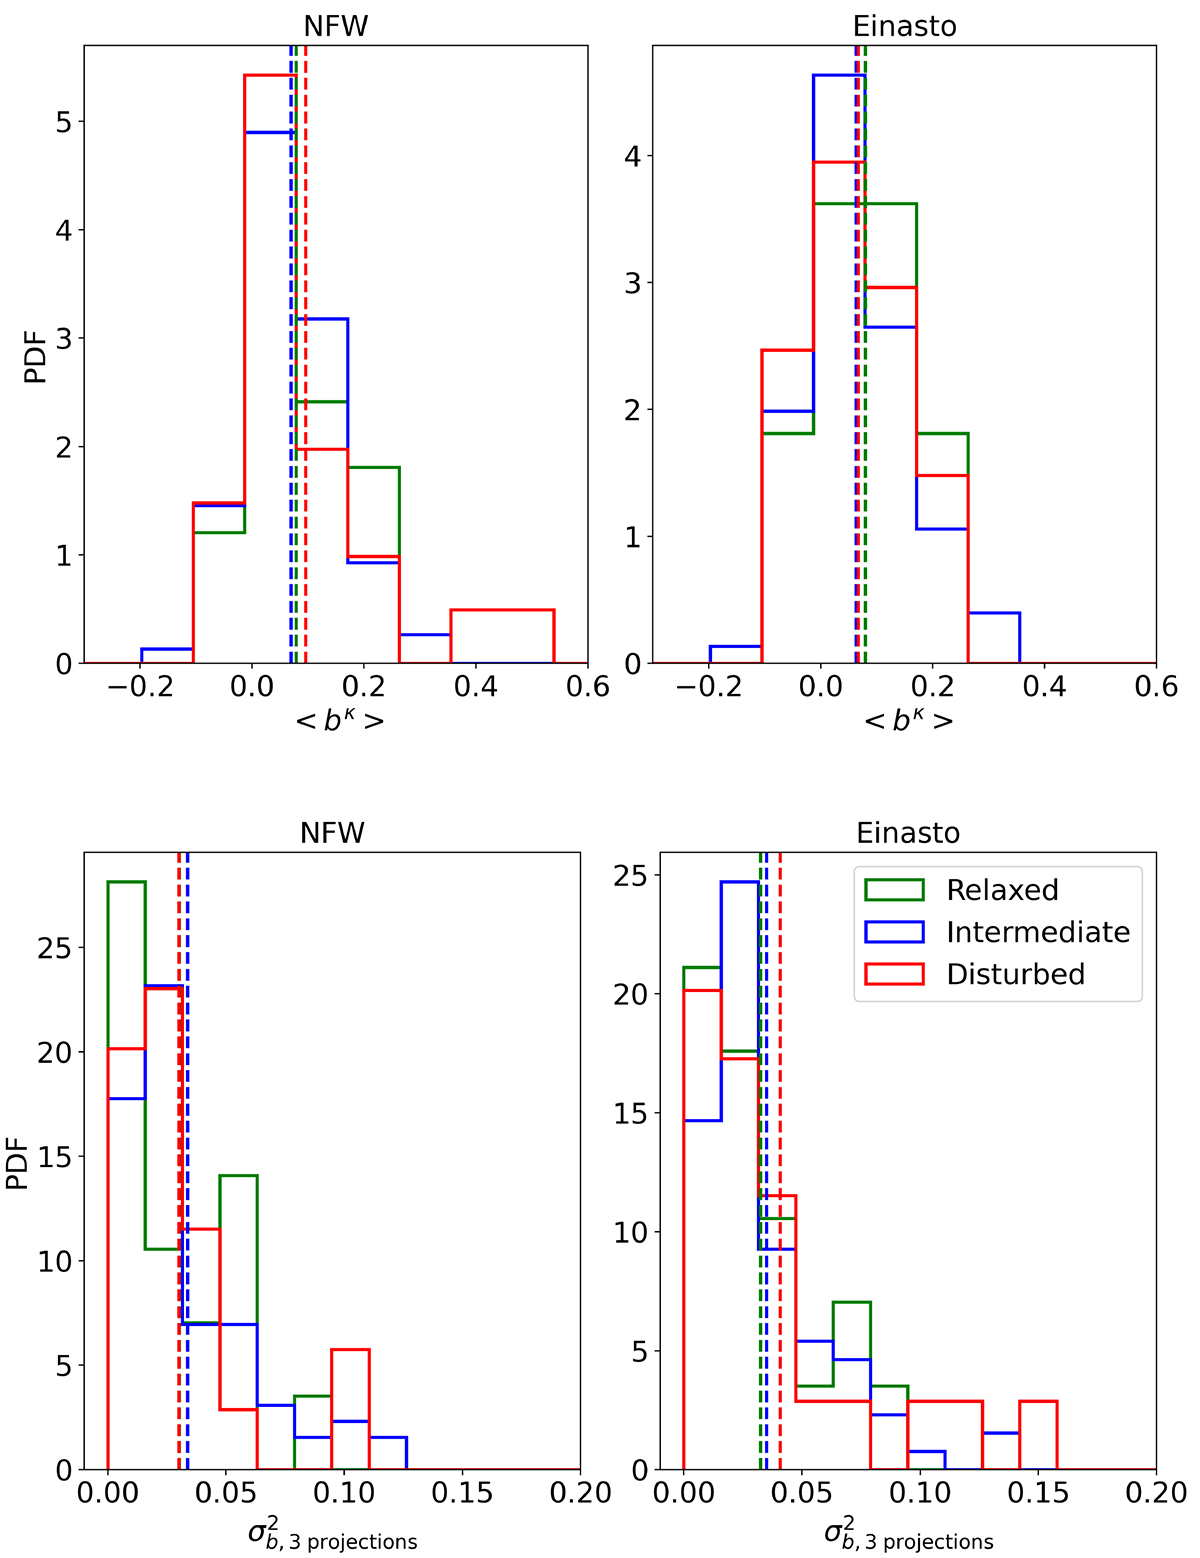
Fig. 11.
Download original image
Bias properties depending on the dynamical state of clusters within R200. Top: distributions of the mean bias per cluster for relaxed (green), intermediate (blue), and disturbed (red) clusters. We show the bias from NFW (left) and Einasto (right) reconstructions. Bottom: distributions of the variance of the bias per cluster accounting for three projections. Clusters are classified according to their dynamical state and results for NFW (left) and Einasto (right) are shown. The vertical lines show the mean values of the distributions.
Current usage metrics show cumulative count of Article Views (full-text article views including HTML views, PDF and ePub downloads, according to the available data) and Abstracts Views on Vision4Press platform.
Data correspond to usage on the plateform after 2015. The current usage metrics is available 48-96 hours after online publication and is updated daily on week days.
Initial download of the metrics may take a while.