Open Access
Fig. 10.
Download original image
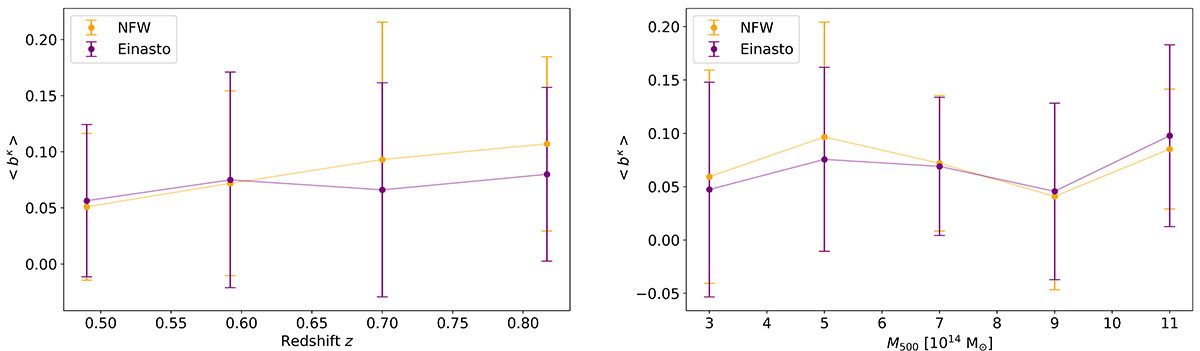
Bias for clusters in different redshift (left) and mass (right) bins. We give the mean value and the σb, mean scatter for the mean bias of clusters in each bin. Results for NFW and Einasto models are shown in orange and purple, respectively, with a line as a guide to the eye.
Current usage metrics show cumulative count of Article Views (full-text article views including HTML views, PDF and ePub downloads, according to the available data) and Abstracts Views on Vision4Press platform.
Data correspond to usage on the plateform after 2015. The current usage metrics is available 48-96 hours after online publication and is updated daily on week days.
Initial download of the metrics may take a while.