Open Access
Fig. 13
Download original image
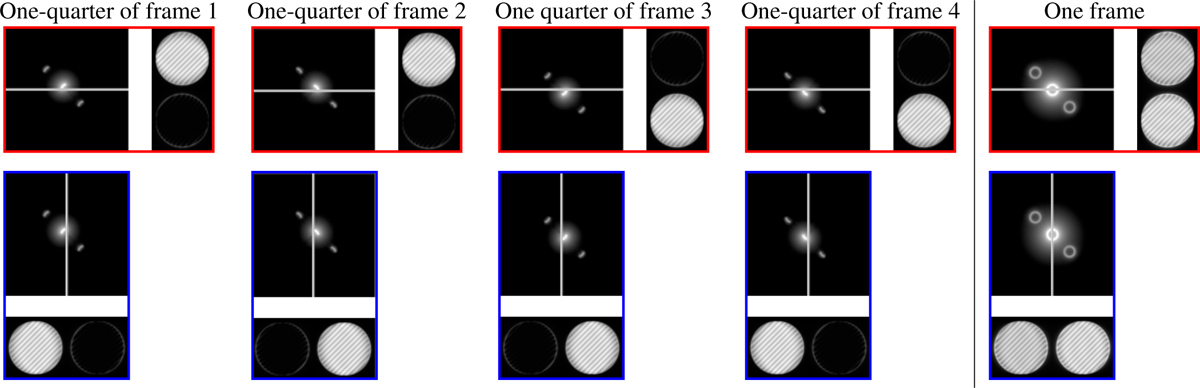
Signal created for each quarter of a full modulation cycle for the sharp Bi–O edge. The red frames correspond to the first channel (split horizontally), and the blue frames show the second channel (split vertically).
Current usage metrics show cumulative count of Article Views (full-text article views including HTML views, PDF and ePub downloads, according to the available data) and Abstracts Views on Vision4Press platform.
Data correspond to usage on the plateform after 2015. The current usage metrics is available 48-96 hours after online publication and is updated daily on week days.
Initial download of the metrics may take a while.