Fig. B.1
Download original image
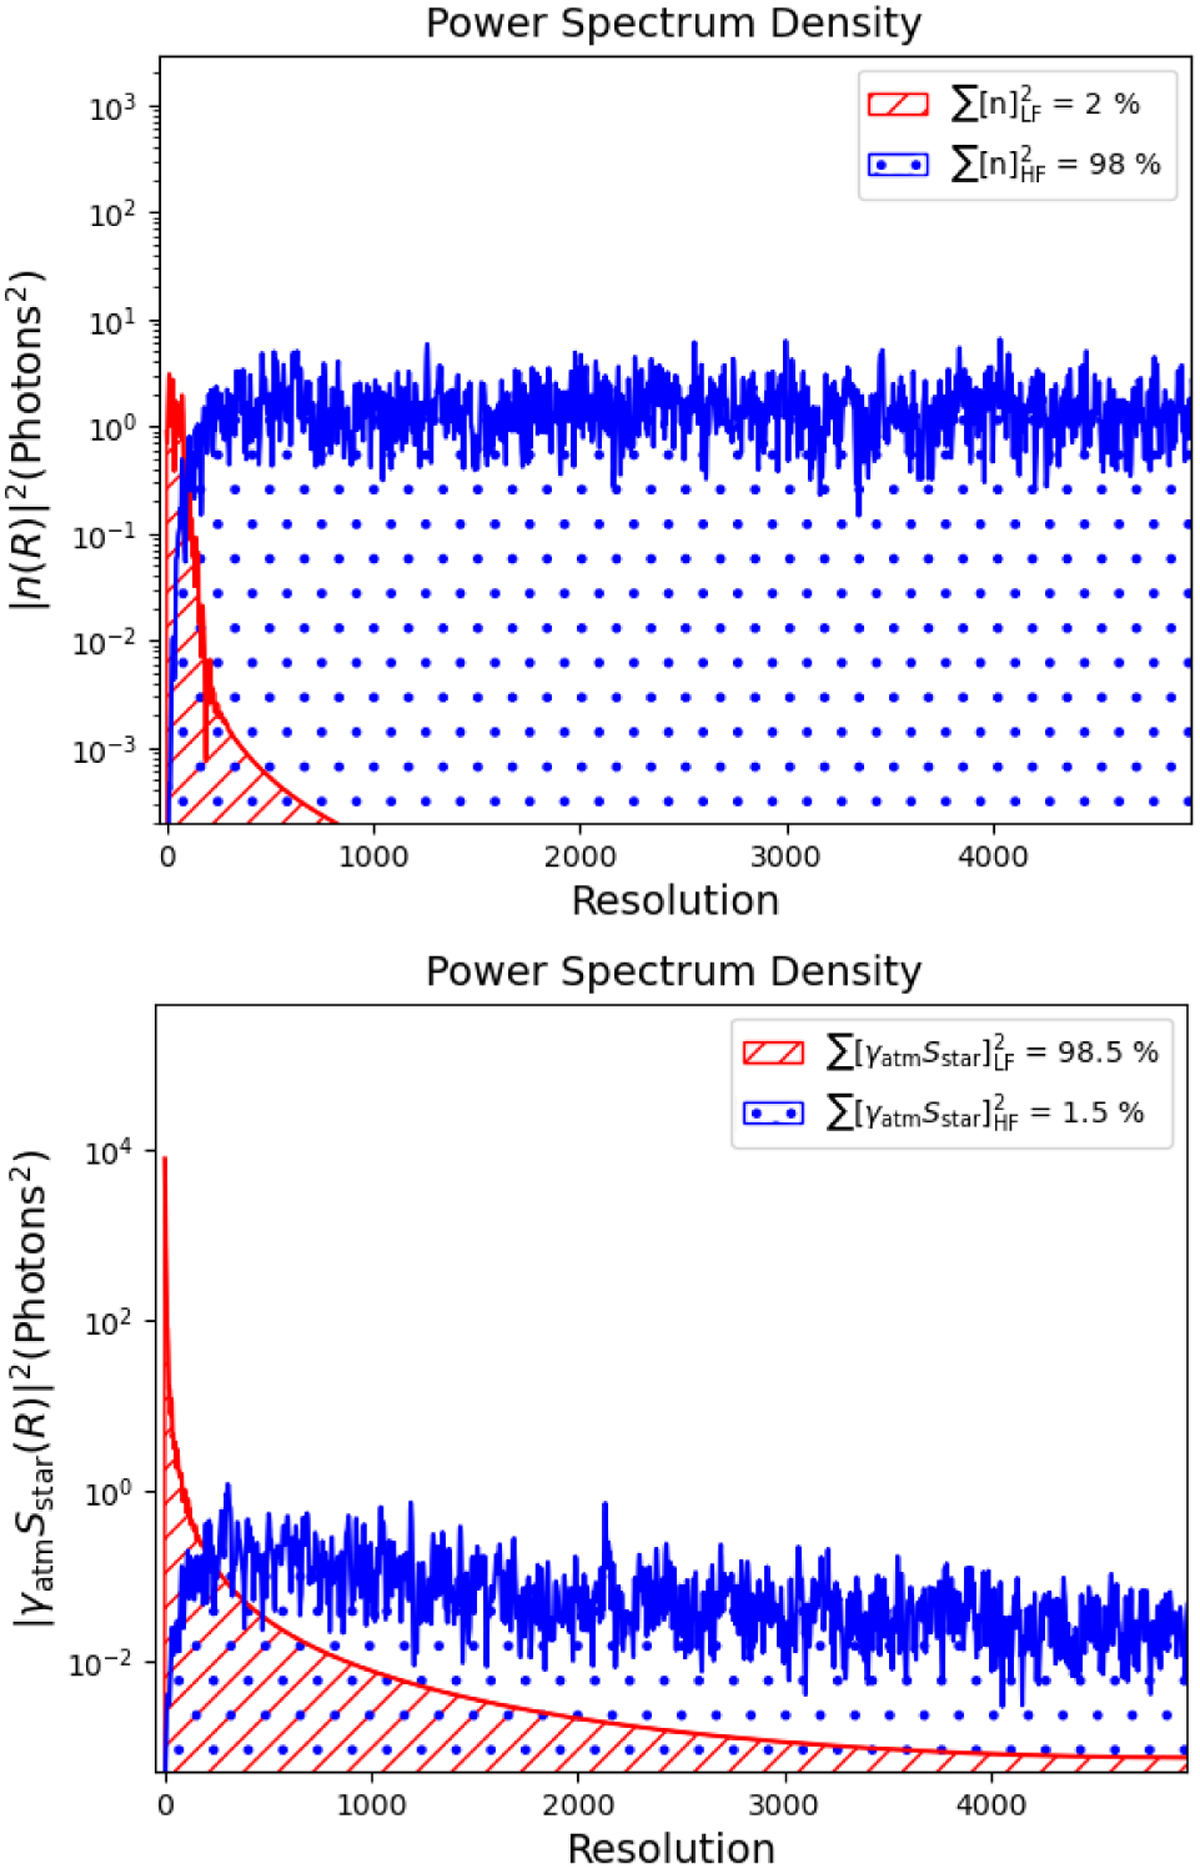
Relative weight of the low frequency and high frequency part of the noise and stellar signal. Top panel: PSDs of the high-pass filtered noise (in blue) and of the complementary low-pass filtered noise (in red). Bottom panel: Stellar spectrum PSD with the high-frequency part in blue and the low-frequency part in red. The star spectrum corresponds to a M-star and the tellurics to present a case where we have a strong high-frequency content.
Current usage metrics show cumulative count of Article Views (full-text article views including HTML views, PDF and ePub downloads, according to the available data) and Abstracts Views on Vision4Press platform.
Data correspond to usage on the plateform after 2015. The current usage metrics is available 48-96 hours after online publication and is updated daily on week days.
Initial download of the metrics may take a while.