Fig. A.1.
Download original image
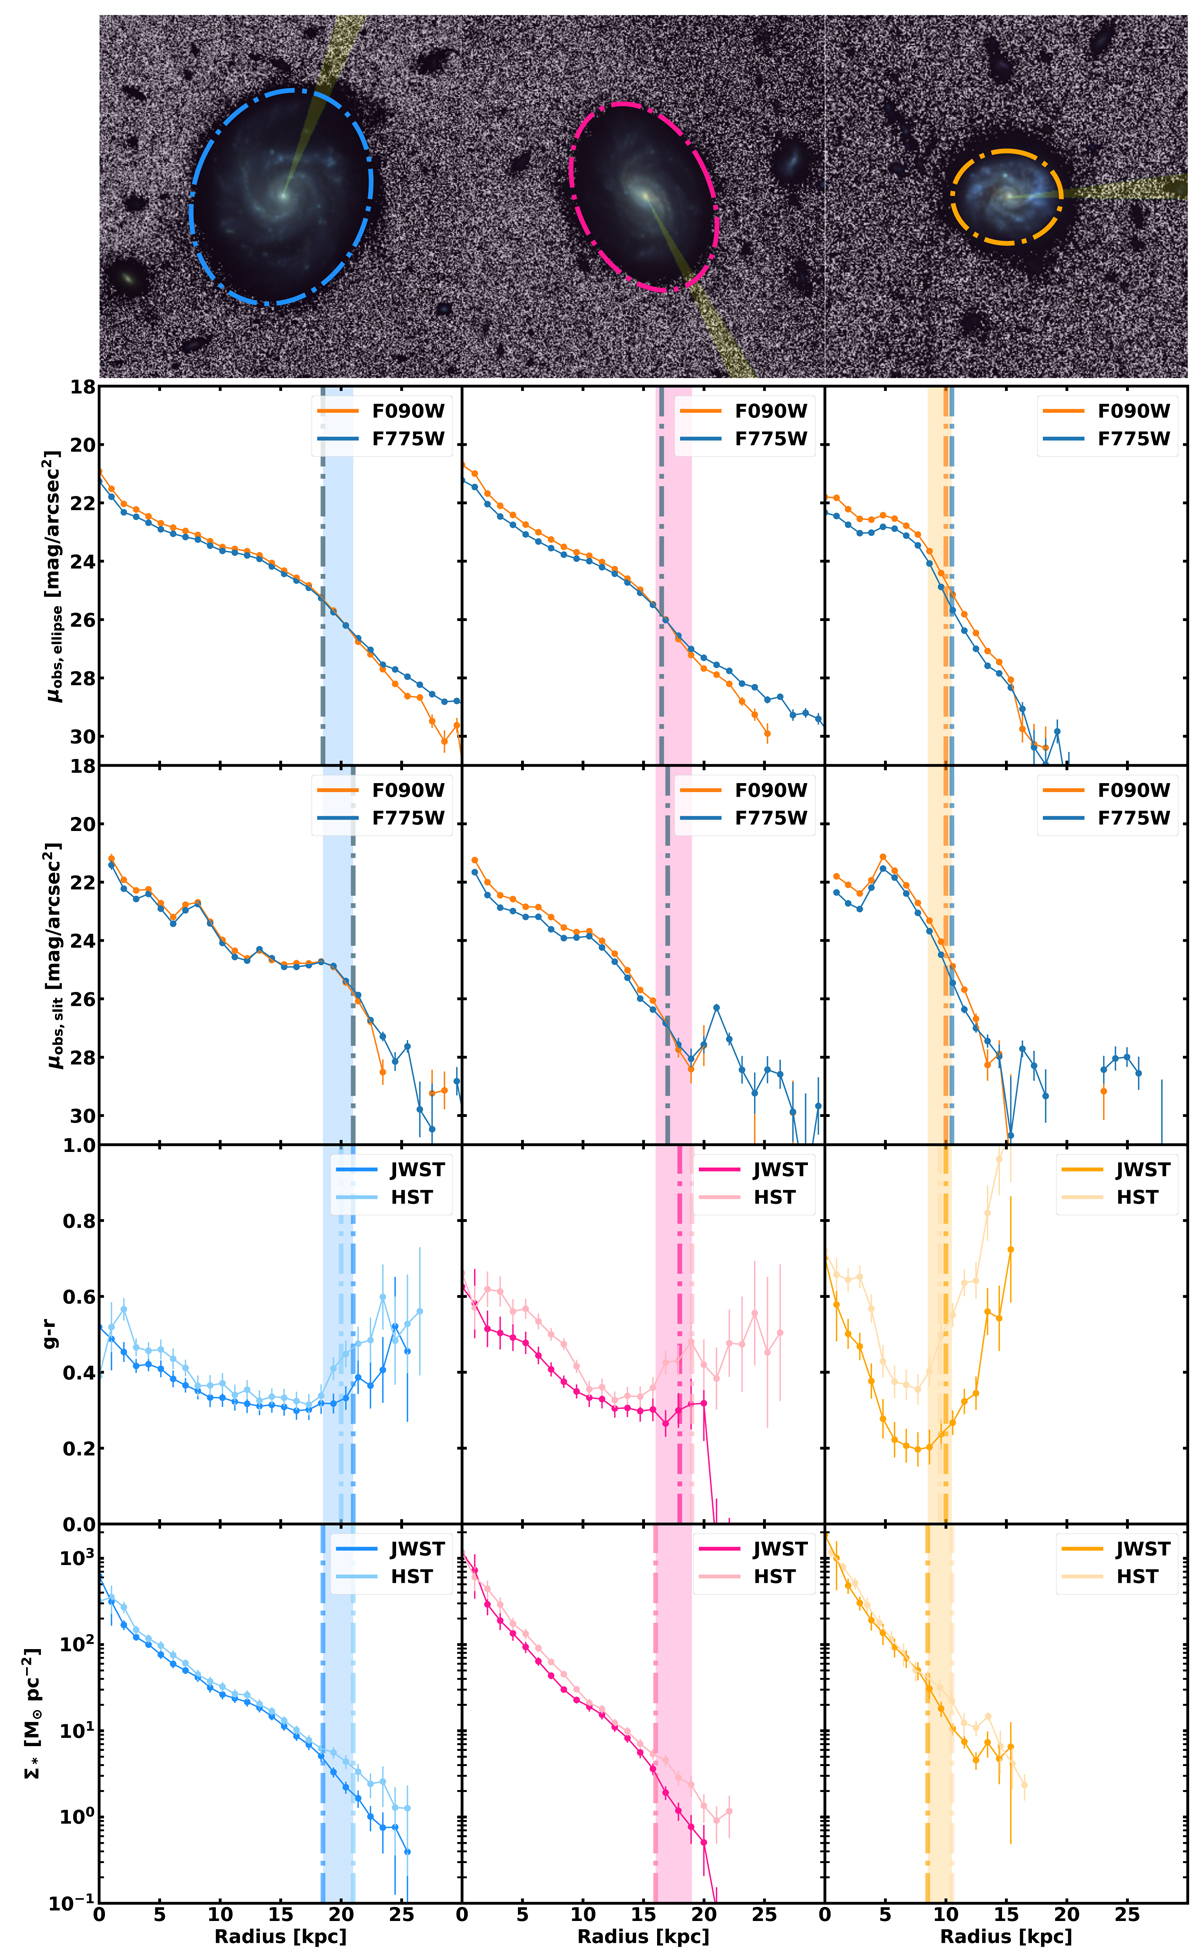
Comparison between HST and JWST datasets for a sample of three MW-like galaxies with similar stellar masses (Mstellar ∼ 5 × 10¹⁰ M⊙) at different redshifts (from left to right): A) 17058_GOODSS at z = 0.6218 in blue, B) 12634_GOODSS at z = 0.6684 in magenta, and C) 12887_GOODSS at z = 0.997 in dark yellow. The first row shows their colour RGB images (based on JWST data; 70×70 kpc), with their sizes (Redge) highlighted by dotted dashed lines, whose positions are also marked in the plots below. The orientation of the “slit” we used to extract the profiles plotted in the panels of the third row is shown in yellow. The second row shows the surface brightness profiles in F775W (HST) and F090W (JWST) using azimuthally averaged profiles (“ellipse method”). The third row is similar to the second, but this time following the semi-major axis profiles (“slit method”). The fourth row shows the g − r colour profiles derived with each telescope, and the fifth row shows the stellar surface mass density profiles based on HST and JWST. In each panel, the vertical dashed lines indicate the position of Redge according to the methodology proposed in this paper. The coloured vertical regions indicate the uncertainty at measuring the position of the edge of the galaxy using independently the information given in each panel.
Current usage metrics show cumulative count of Article Views (full-text article views including HTML views, PDF and ePub downloads, according to the available data) and Abstracts Views on Vision4Press platform.
Data correspond to usage on the plateform after 2015. The current usage metrics is available 48-96 hours after online publication and is updated daily on week days.
Initial download of the metrics may take a while.