Fig. 7.
Download original image
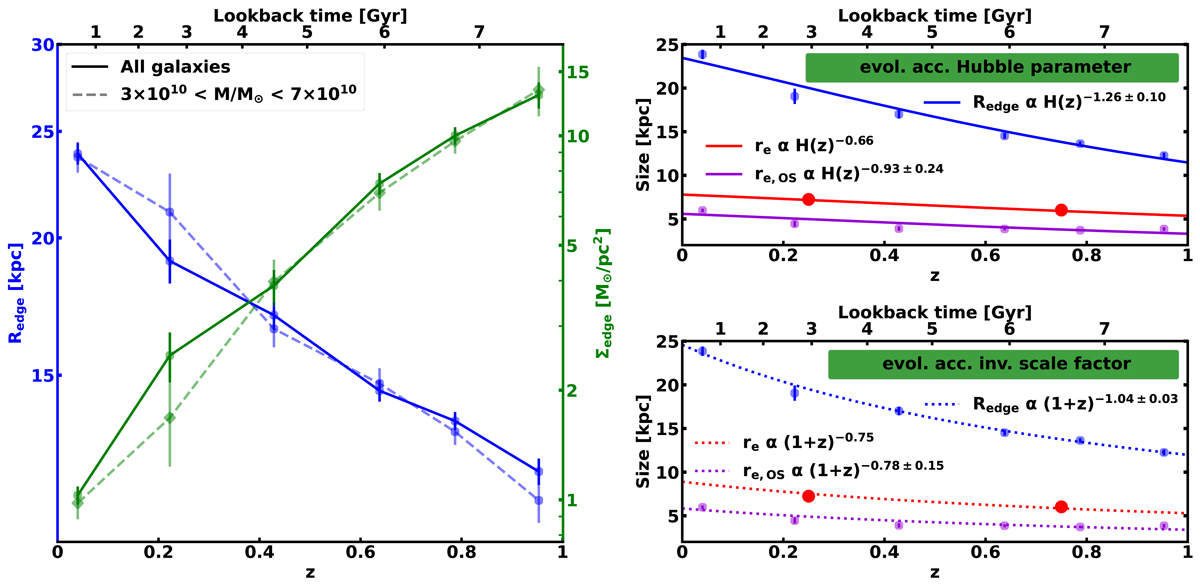
Left column: Size evolution of disc galaxies using as a proxy the radial location of the edge of the star forming discs (Redge; see left blue axis). We also show the evolution of the stellar mass surface density at the edge (Σedge; see right green axis). The solid lines show the evolution corresponding to a disc galaxy with the stellar mass of the MW (i.e. Mstellar ∼ 5 × 10¹⁰ M⊙) according to the best linear fitting to the entire population (see text for details). The dashed lines correspond to the average properties of galaxies within the stellar mass range 3 × 10¹⁰ < M/M⊙ < 7 × 10¹⁰. The redshift of each data point corresponds to the median value of the galaxy redshifts for each redshift bin. MW-like galaxies increase on average their sizes by a factor of ∼2 since z = 1. The stellar mass surface density at the end of their star forming discs (Σedge) decreased by an order of magnitude since that epoch. Right column: Evolution of the size of the galaxies in our sample using as a size indicator either the edge of the star forming discs (Redge; blue points) or its effective radius (re, OS; purple points with the subscript OS indicating the galaxies of Our Sample). In the upper panel this evolution is fitted using a power-law function of the Hubble parameter H(z) while in the lower panel we use a power-law function of the inverse of the scale factor (i.e. (1 + z)). We add for comparison the evolution of the effective radius for the general population of star forming galaxies given in van der Wel et al. (2014).
Current usage metrics show cumulative count of Article Views (full-text article views including HTML views, PDF and ePub downloads, according to the available data) and Abstracts Views on Vision4Press platform.
Data correspond to usage on the plateform after 2015. The current usage metrics is available 48-96 hours after online publication and is updated daily on week days.
Initial download of the metrics may take a while.