Fig. 6.
Download original image
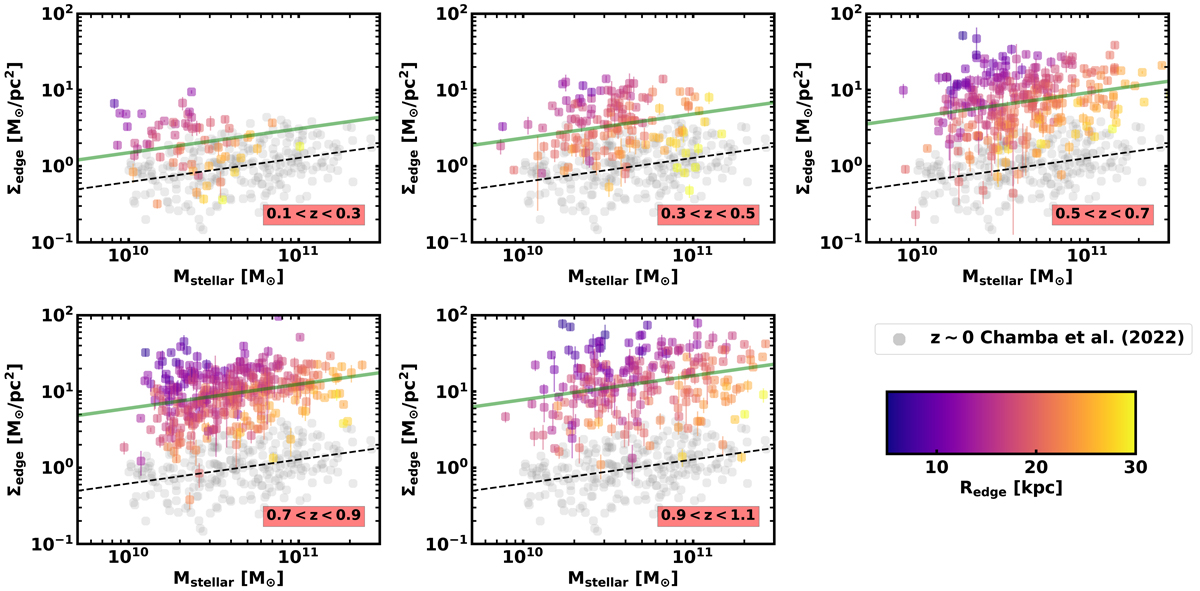
Stellar surface mass densities (Σedge) at the radial position of the edge versus galaxy stellar mass for our galaxy sample. The black dashed line represents the linear regression to the local values from Chamba et al. (2022; in grey, visible at all redshifts) and the green solid line depicts the linear regression fitting at each redshift. The data points are coloured according to their size (Redge) and the Σedge error bars come from the error bars in the stellar mass density profiles at the Redge position. A progressive departure from the nearby Universe values towards higher densities is appreciable. The data points are colour coded according their galaxy size. At a fixed stellar mass, those galaxies with the larger stellar surface mass densities are those smaller in size.
Current usage metrics show cumulative count of Article Views (full-text article views including HTML views, PDF and ePub downloads, according to the available data) and Abstracts Views on Vision4Press platform.
Data correspond to usage on the plateform after 2015. The current usage metrics is available 48-96 hours after online publication and is updated daily on week days.
Initial download of the metrics may take a while.