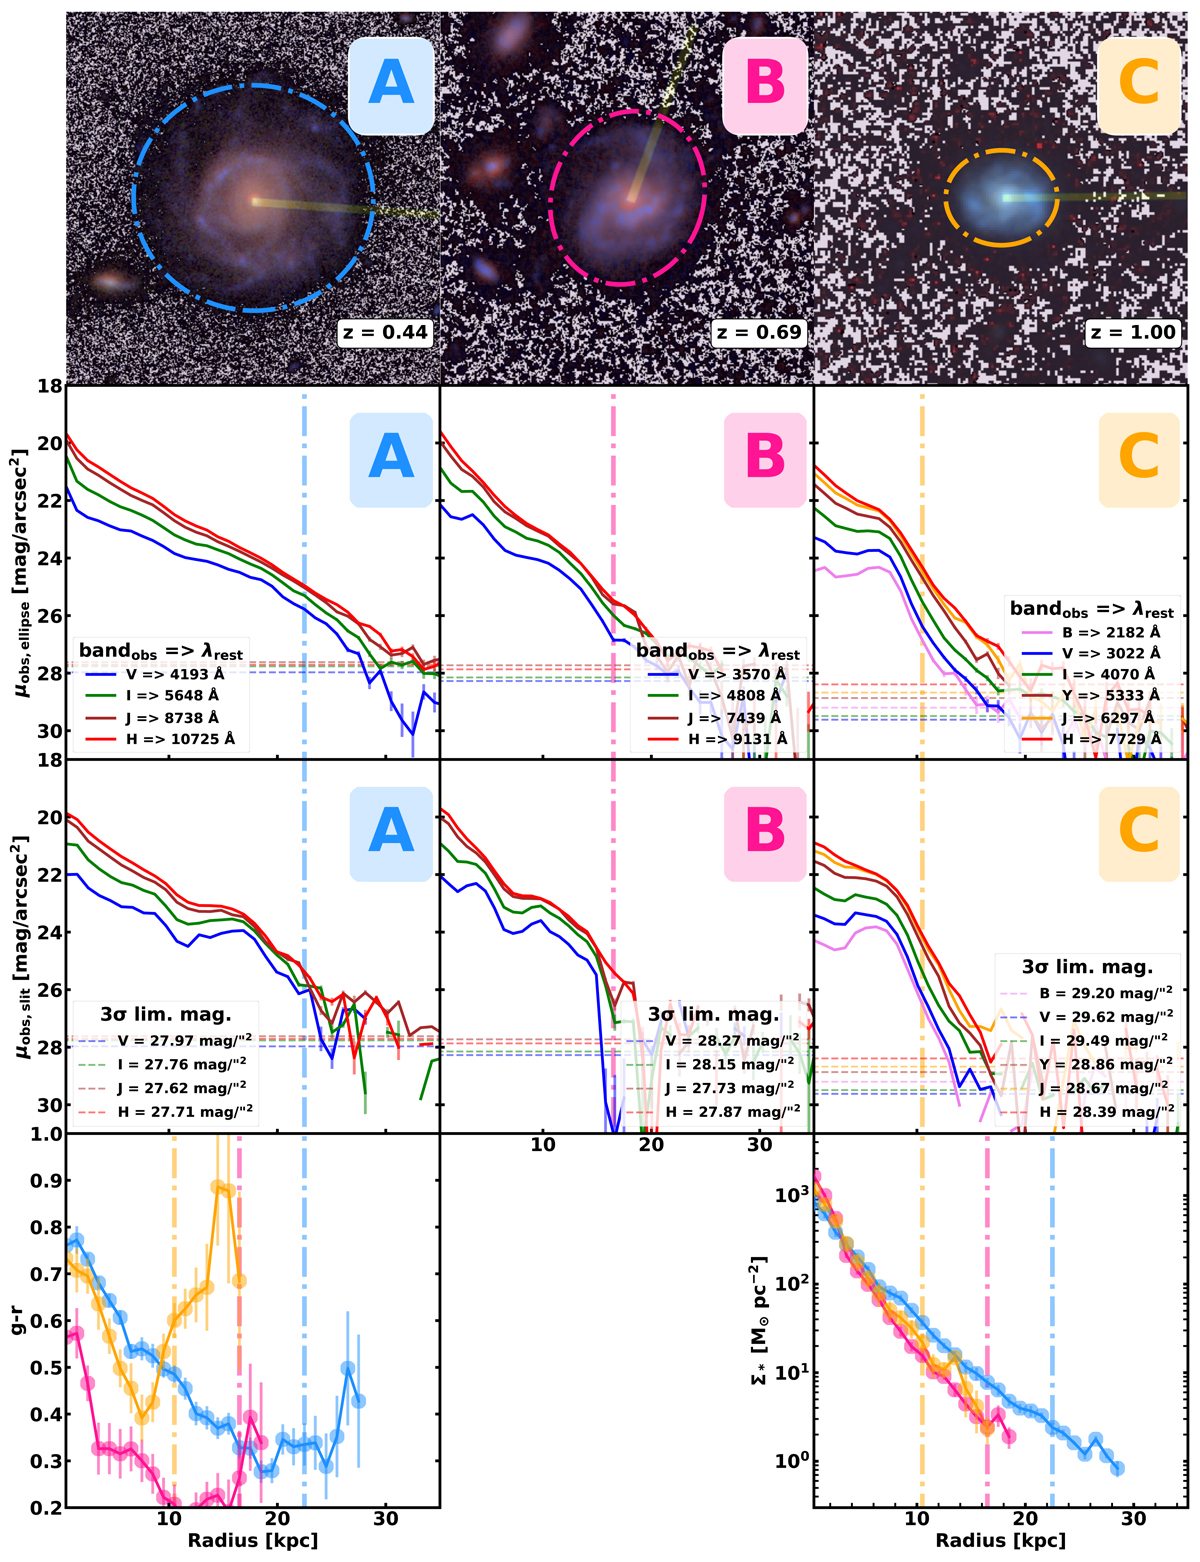
Fig. 4.
Download original image
Summary of our analysis for three MW-like galaxies at different redshifts (from left to right): (A) 9217_COSMOS at z = 0.44 in blue, (B) 20537_EGS at z = 0.69 in magenta, and (C) 12887_GOODSS at z = 0.997 in dark yellow. The first row displays their colour RGB images with their sizes (Redge) highlighted by dot-dashed lines whose positions are also marked in the plots below. The orientation of the “slit” we used to extract the slit profiles plotted in the panels of the third row is shown in yellow. The second row shows the surface brightness profiles in V-, I-, J- and H-band using azimuthally averaged profiles (“ellipse method”) while the horizontal lines denote the images’ observed 3σ limiting surface brightness magnitudes in 1 × 1 arcsec2 boxes. The legend gives the equivalent restframe central wavelength for each observed filter. The third row is similar to the second, but this time following the semi-major axis (“slit method”) profiles. The observed limiting surface brightness is written explicitly this time in the legend. For the fourth row, the bottom left plot shows the g − r colour profiles and the bottom right the stellar surface mass density profiles.
Current usage metrics show cumulative count of Article Views (full-text article views including HTML views, PDF and ePub downloads, according to the available data) and Abstracts Views on Vision4Press platform.
Data correspond to usage on the plateform after 2015. The current usage metrics is available 48-96 hours after online publication and is updated daily on week days.
Initial download of the metrics may take a while.