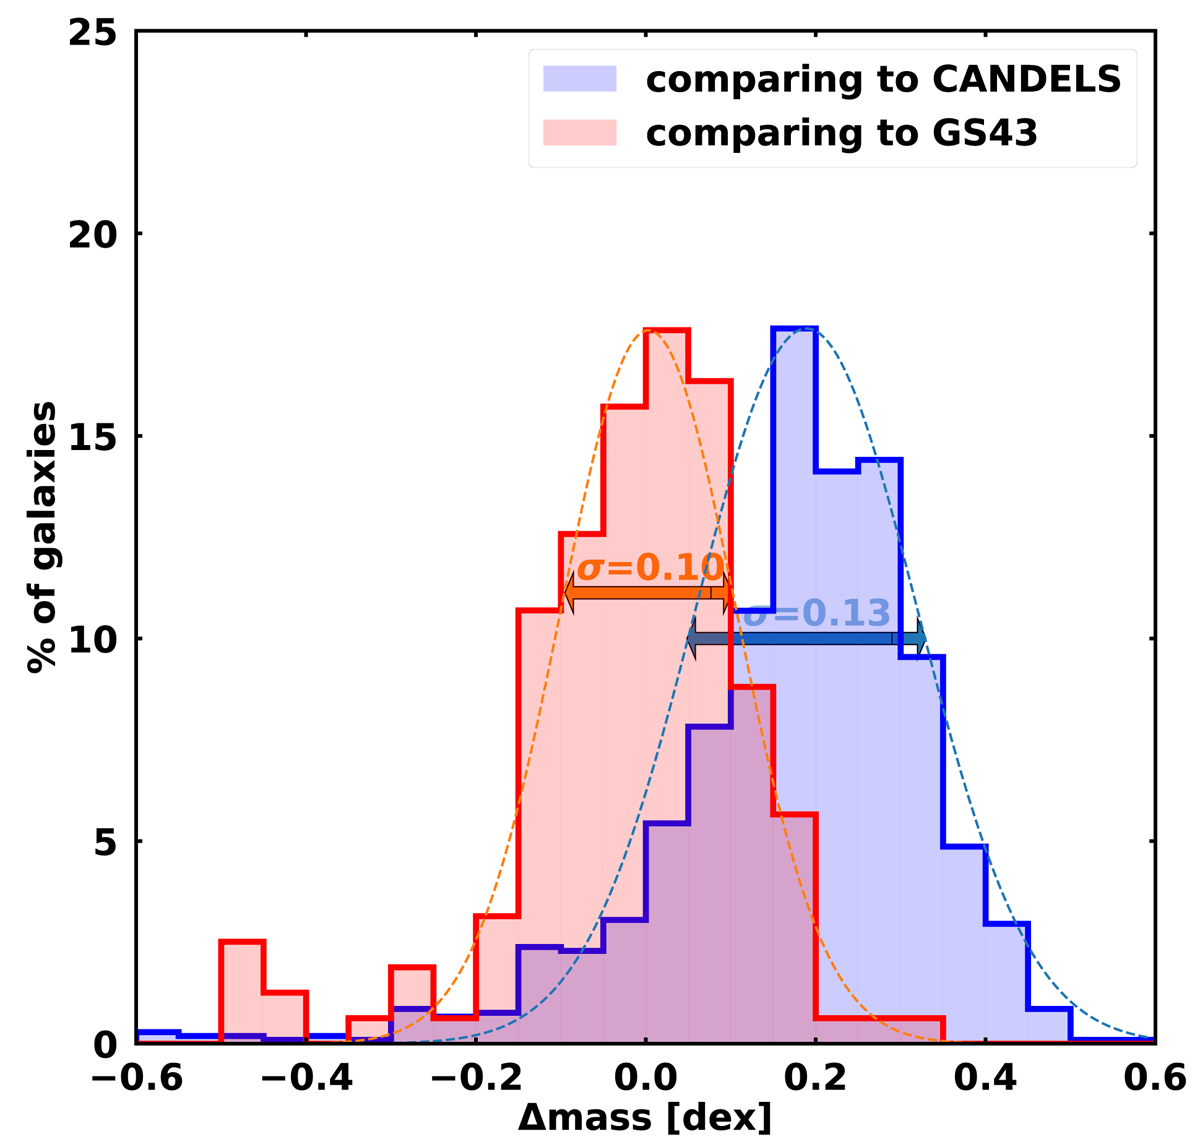
Fig. 3.
Download original image
Comparison between our photometrically derived stellar masses and those in the CANDELS and ASTRODEEP GS43 catalogues (Δmass = log(Mours)–log(Mcatalog)). The dashed lines represent the best Gaussian fits (their scatter is also displayed). The arrows with the sigma values are displaced vertically for the blue distribution for the sake of clarity.
Current usage metrics show cumulative count of Article Views (full-text article views including HTML views, PDF and ePub downloads, according to the available data) and Abstracts Views on Vision4Press platform.
Data correspond to usage on the plateform after 2015. The current usage metrics is available 48-96 hours after online publication and is updated daily on week days.
Initial download of the metrics may take a while.