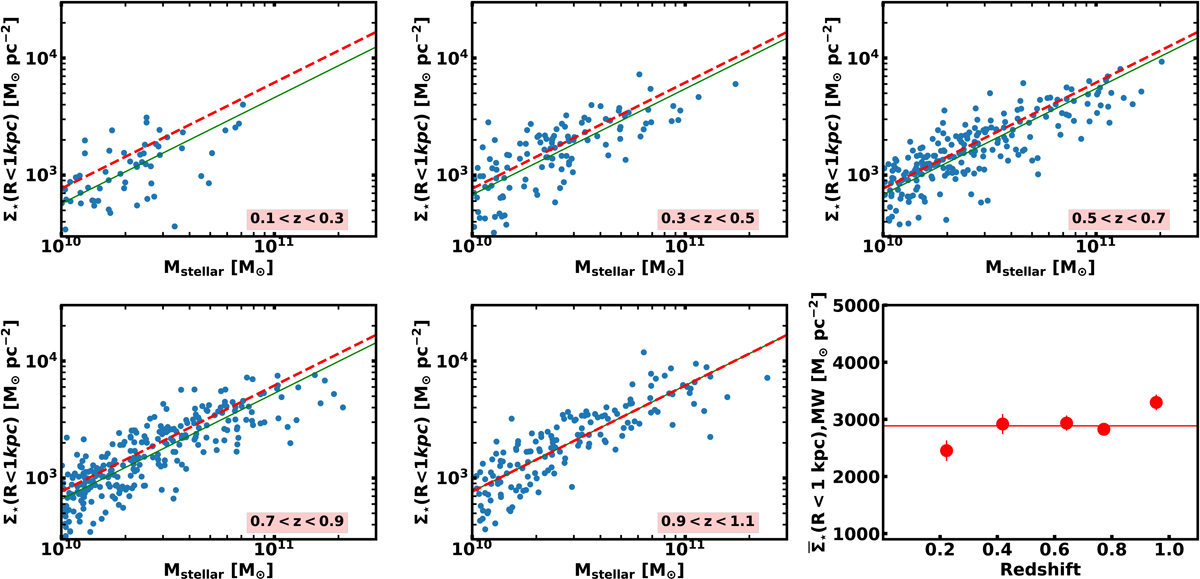
Fig. G.1.
Download original image
Relation between the central stellar mass surface density of our disc galaxies (measured by the mean surface mass density within 1 kpc) and the stellar mass. The red dashed line corresponds to the fit to the data points in the highest redshift bin (0.9 < z < 1.1). The green lines at each redshift bin are the fits to the data points using a fixed slope equal to that measured at the highest redshift bin. The lower right panel shows the evolution with redshift of the central surface mass density of galaxies of similar mass to the Milky Way (i.e. Mstellar = 5×10¹⁰ M⊙). Errors come from bootstrapping 104 times our measurements. In contrast to the evolution of the stellar surface mass density at the edge of the galaxy, the central density remains relatively unchanged over the last 8 Gyr.
Current usage metrics show cumulative count of Article Views (full-text article views including HTML views, PDF and ePub downloads, according to the available data) and Abstracts Views on Vision4Press platform.
Data correspond to usage on the plateform after 2015. The current usage metrics is available 48-96 hours after online publication and is updated daily on week days.
Initial download of the metrics may take a while.