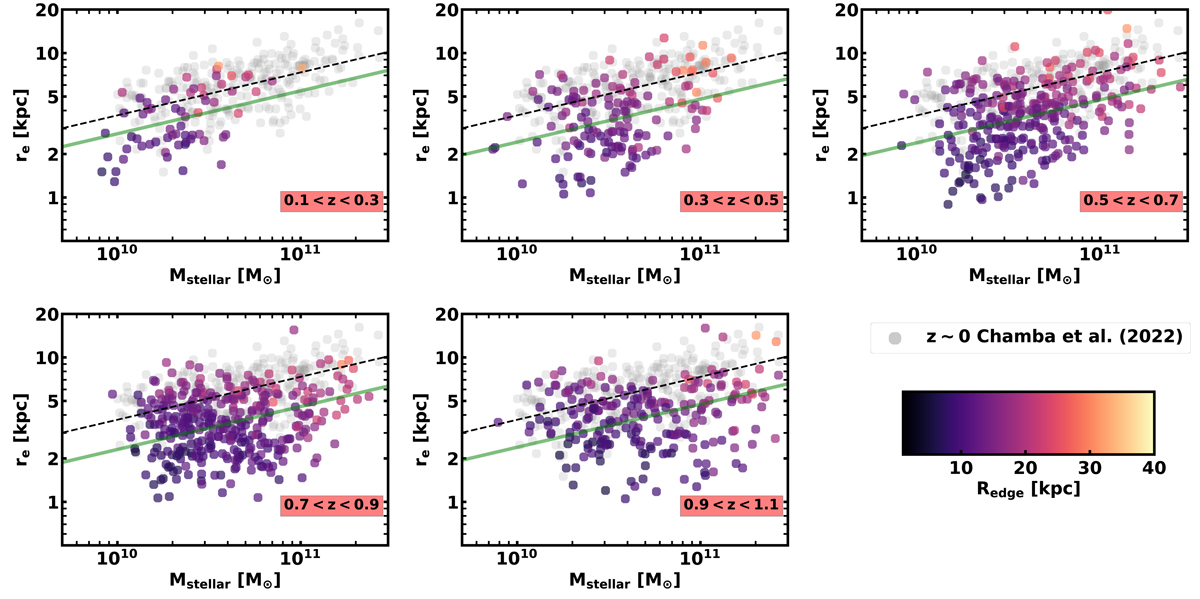
Fig. F.1.
Download original image
Effective radius - mass relation for the galaxies in our sample. The local sample corresponds to the galaxies used in Chamba et al. (2022) while the effective radius of the galaxies explored in this paper were retrieved from van der Wel et al. (2012). The galaxies are colour coded according to the size measured in this work (Redge). The dashed lines correspond to the fitting to the local sample while the green solid lines to the fits to the higher redshift galaxies. The slope of the global fitting is left fixed to the local sample. There is a mild decrease of the effective radii with redshift, but not as steep as in the Redge’s case. Besides, the scatter (∼0.2 dex) is ∼2 times larger than the one found using Redge as a size indicator (∼0.1 dex).
Current usage metrics show cumulative count of Article Views (full-text article views including HTML views, PDF and ePub downloads, according to the available data) and Abstracts Views on Vision4Press platform.
Data correspond to usage on the plateform after 2015. The current usage metrics is available 48-96 hours after online publication and is updated daily on week days.
Initial download of the metrics may take a while.