Fig. 2
Download original image
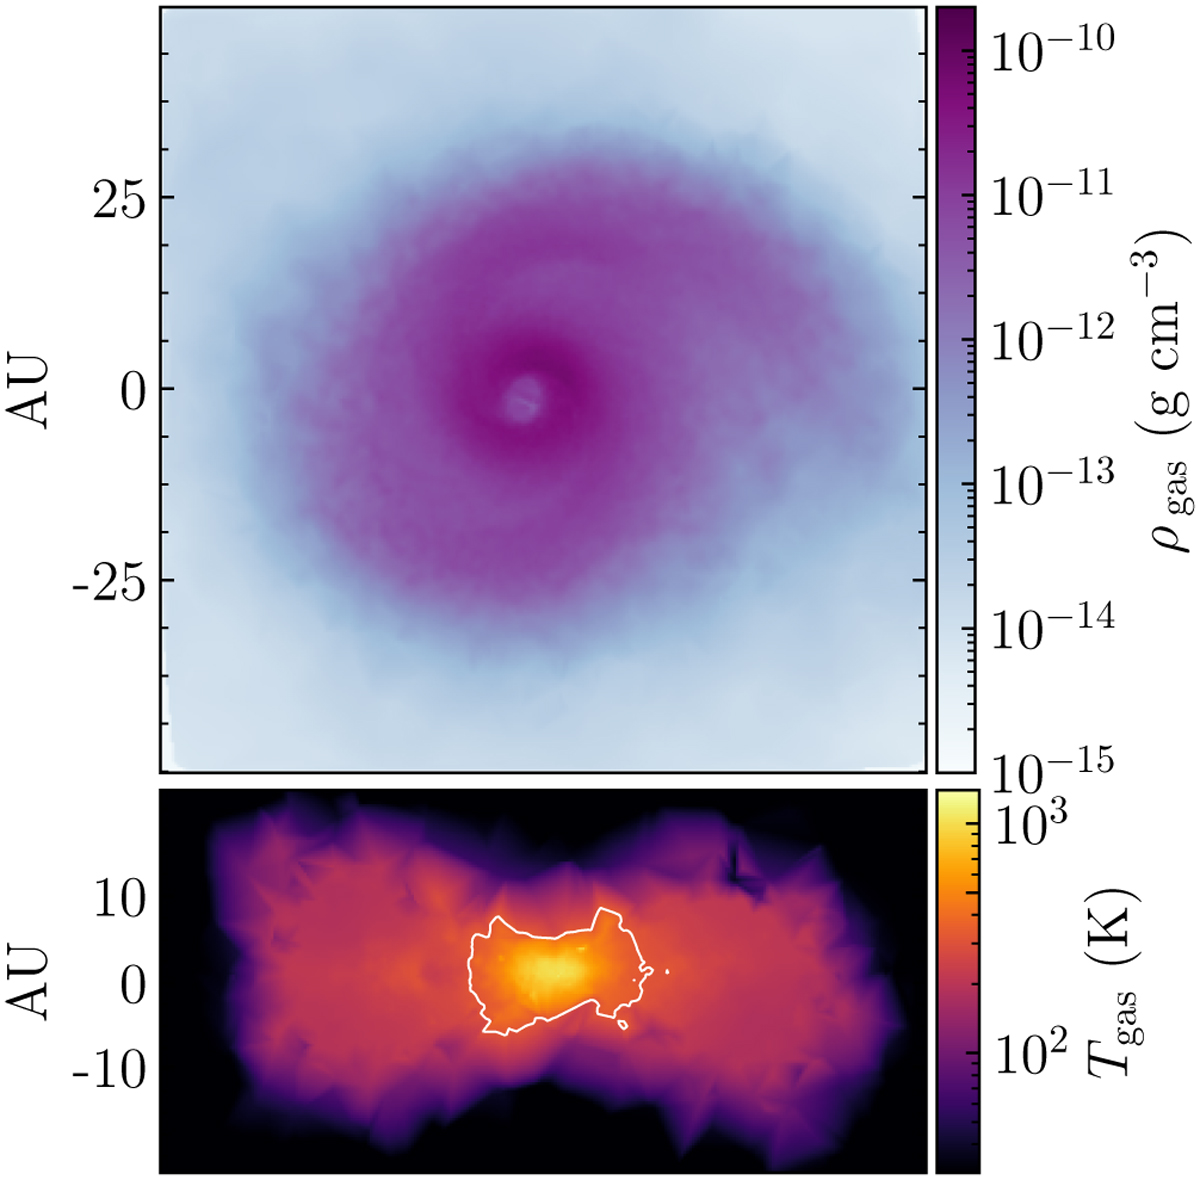
Face-on gas density (top) and edge-on temperature (bottom) distributions across the midplane of the protostellar disk formed from the numerical simulations of the collapse of a core. We note that this is the disk we compared to the observations of IRAS 16293-2422 B. The white contour in the bottom panel represents the extension of the soot line at 300 K. This model is presented in greater detail in Zamponi et al. (2021).
Current usage metrics show cumulative count of Article Views (full-text article views including HTML views, PDF and ePub downloads, according to the available data) and Abstracts Views on Vision4Press platform.
Data correspond to usage on the plateform after 2015. The current usage metrics is available 48-96 hours after online publication and is updated daily on week days.
Initial download of the metrics may take a while.