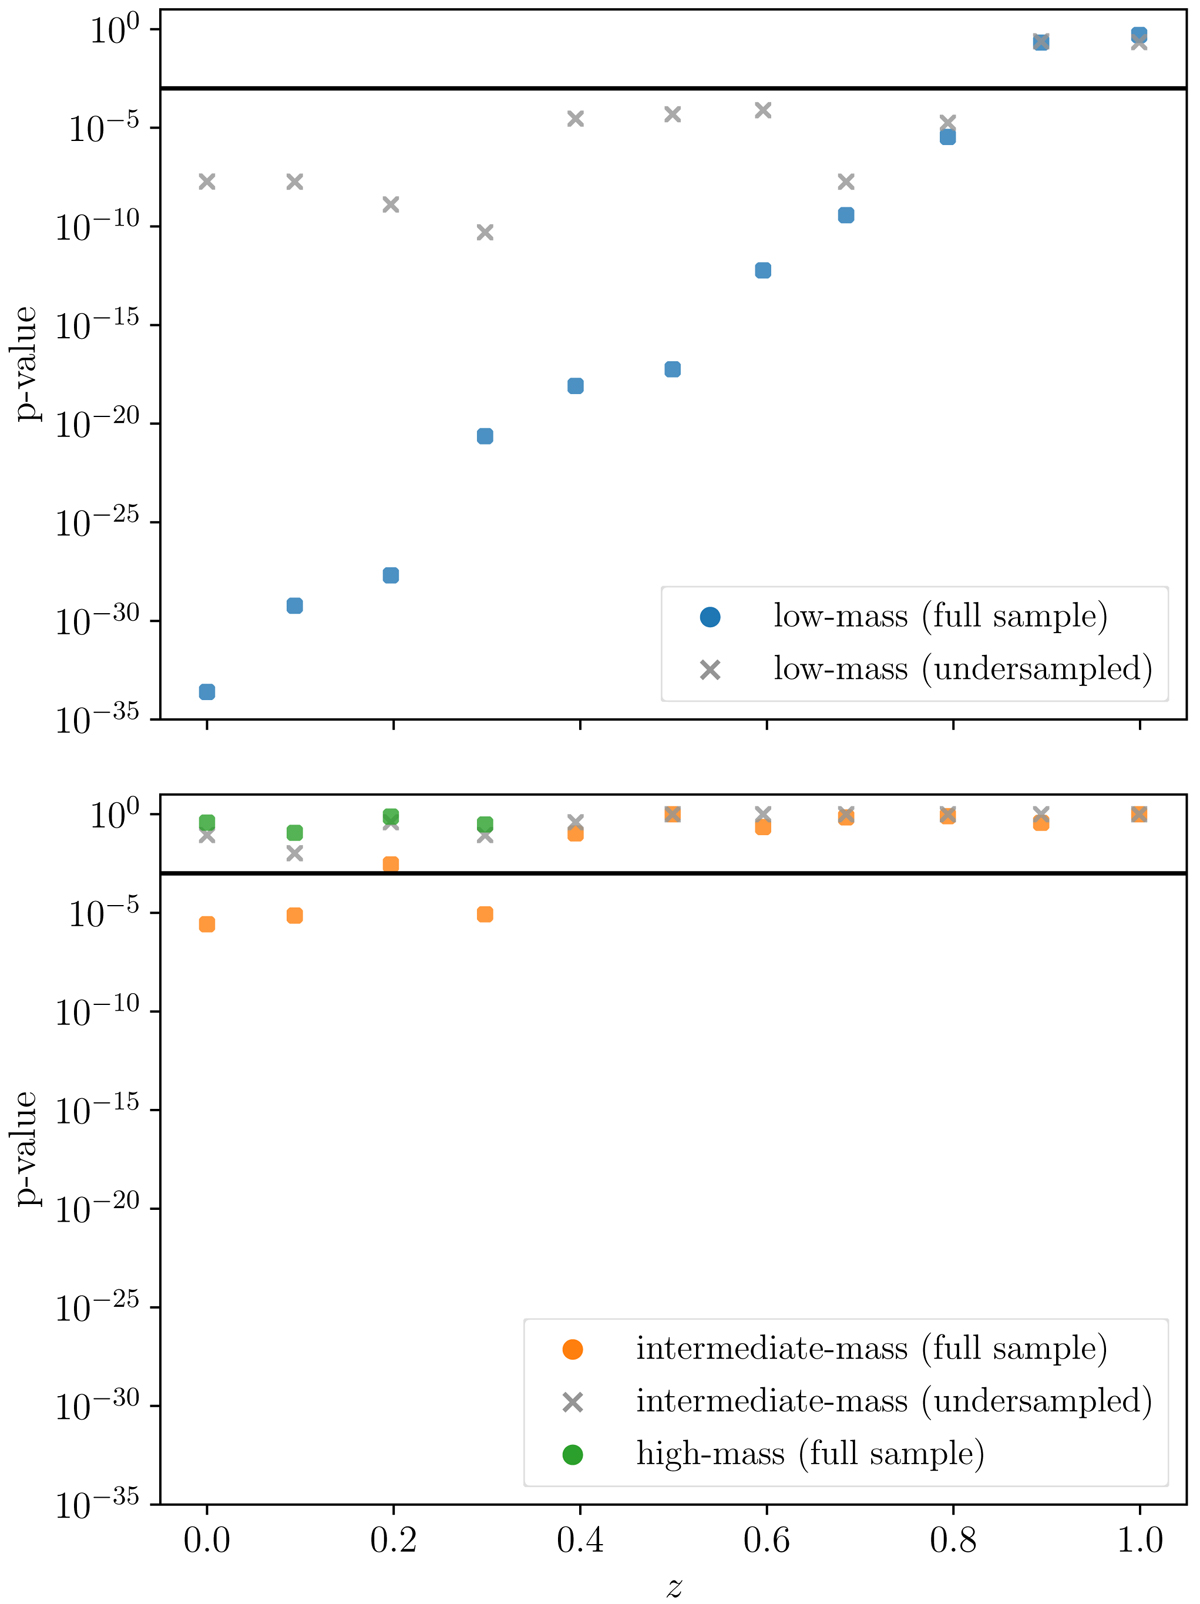
Fig. 6.
Download original image
p-values of the median test to distinguish the two theories of gravity performed on the samples of ςs of the simulated clusters in Table 1. Top panel: blue points show the p-values of the test on the full samples of ςs in the low-mass bin, and the gray crosses show the p-values of the test performed by undersampling all the low-mass samples to 646 halos. Bottom panel: orange and green points show the p-values of the test on the full samples in the intermediate- and high-mass bin, respectively; the gray crosses show the p-values of the test performed by undersampling the intermediate-mass samples to 11 halos. In both panels, the horizontal lines denote p = 10−3.
Current usage metrics show cumulative count of Article Views (full-text article views including HTML views, PDF and ePub downloads, according to the available data) and Abstracts Views on Vision4Press platform.
Data correspond to usage on the plateform after 2015. The current usage metrics is available 48-96 hours after online publication and is updated daily on week days.
Initial download of the metrics may take a while.