Fig. 5.
Download original image
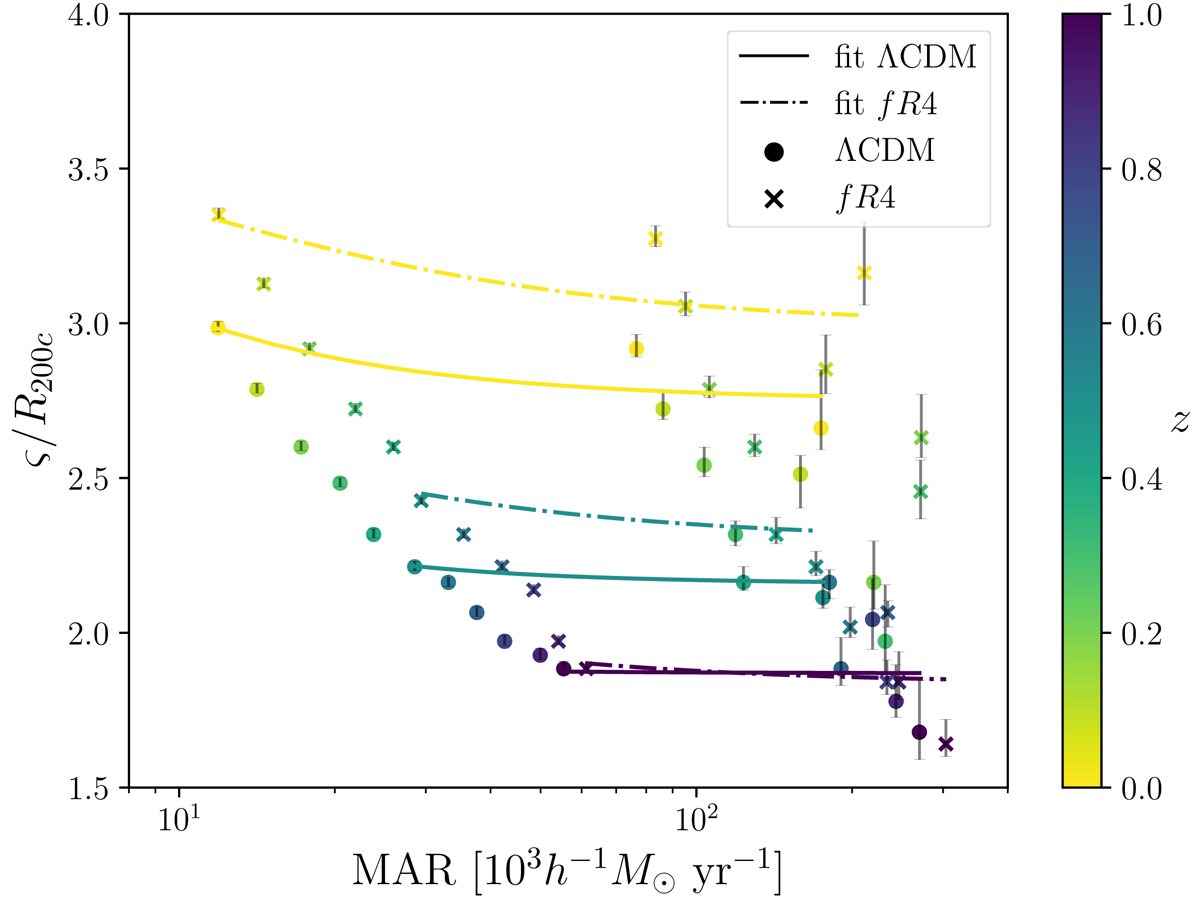
ς as a function of MAR, color-coded by redshift. The circles and crosses show the median values of the ΛCDM and fR4 samples, respectively. The solid (dash-dotted) curves are the fits of Eq. (4) to the ΛCDM (fR4) data at three redshifts. From top to bottom, z = 0.0, 0.5, and 1.0. At fixed redshift, ς decreases with increasing MAR; at fixed MAR, ς decreases as the redshift increases.
Current usage metrics show cumulative count of Article Views (full-text article views including HTML views, PDF and ePub downloads, according to the available data) and Abstracts Views on Vision4Press platform.
Data correspond to usage on the plateform after 2015. The current usage metrics is available 48-96 hours after online publication and is updated daily on week days.
Initial download of the metrics may take a while.