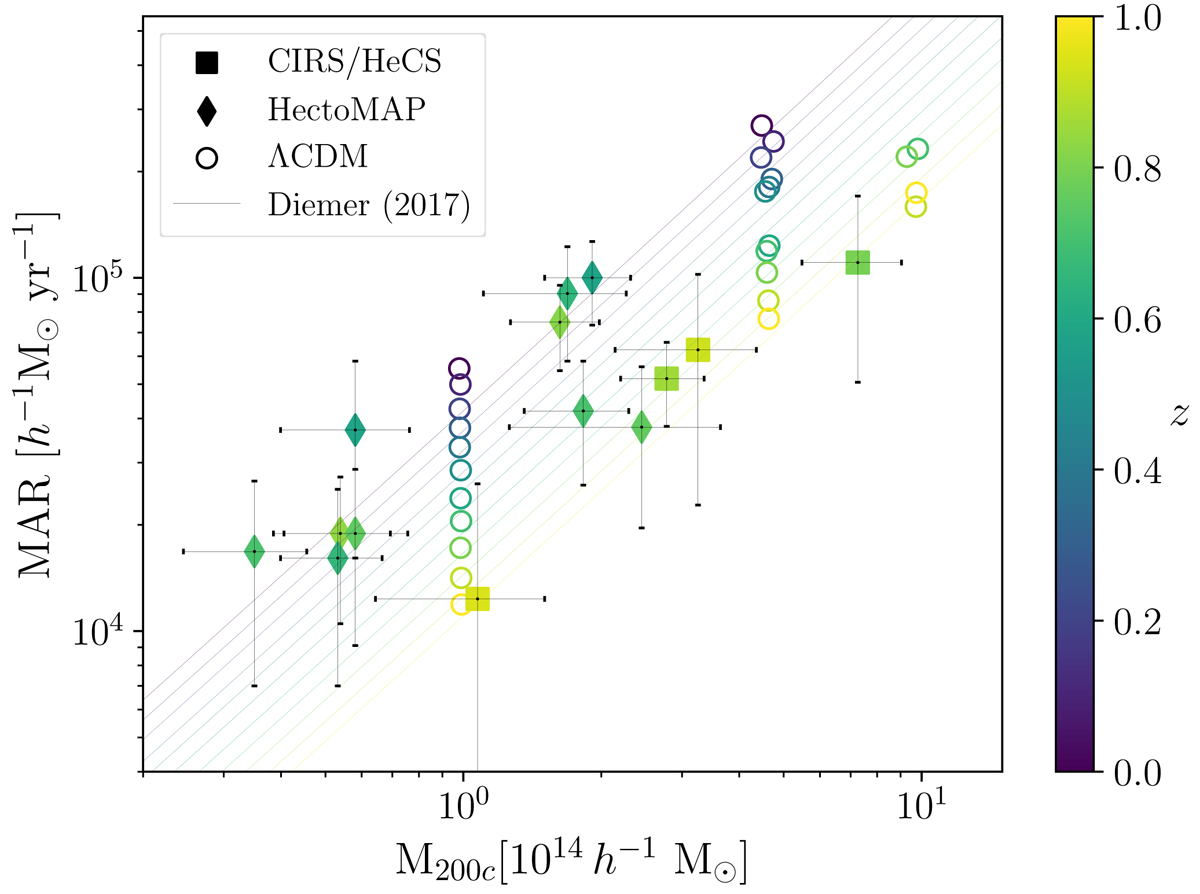
Fig. 4.
Download original image
MAR as a function of the cluster mass M200c in the simulations and the MAR of the CIRS, HeCS, and HectoMAP clusters. The open circles show the median MARs of the 26 ΛCDM samples of Table 1, color-coded by redshift. The colored curves are the relation of Diemer et al. (2017) computed at the 11 redshifts of our simulated samples. The squares and the diamonds with error bars show the MAR estimates with their uncertainties of the stacked clusters of the CIRS and HeCS (Pizzardo et al. 2021) and HectoMAP clusters (Pizzardo et al. 2022), respectively.
Current usage metrics show cumulative count of Article Views (full-text article views including HTML views, PDF and ePub downloads, according to the available data) and Abstracts Views on Vision4Press platform.
Data correspond to usage on the plateform after 2015. The current usage metrics is available 48-96 hours after online publication and is updated daily on week days.
Initial download of the metrics may take a while.