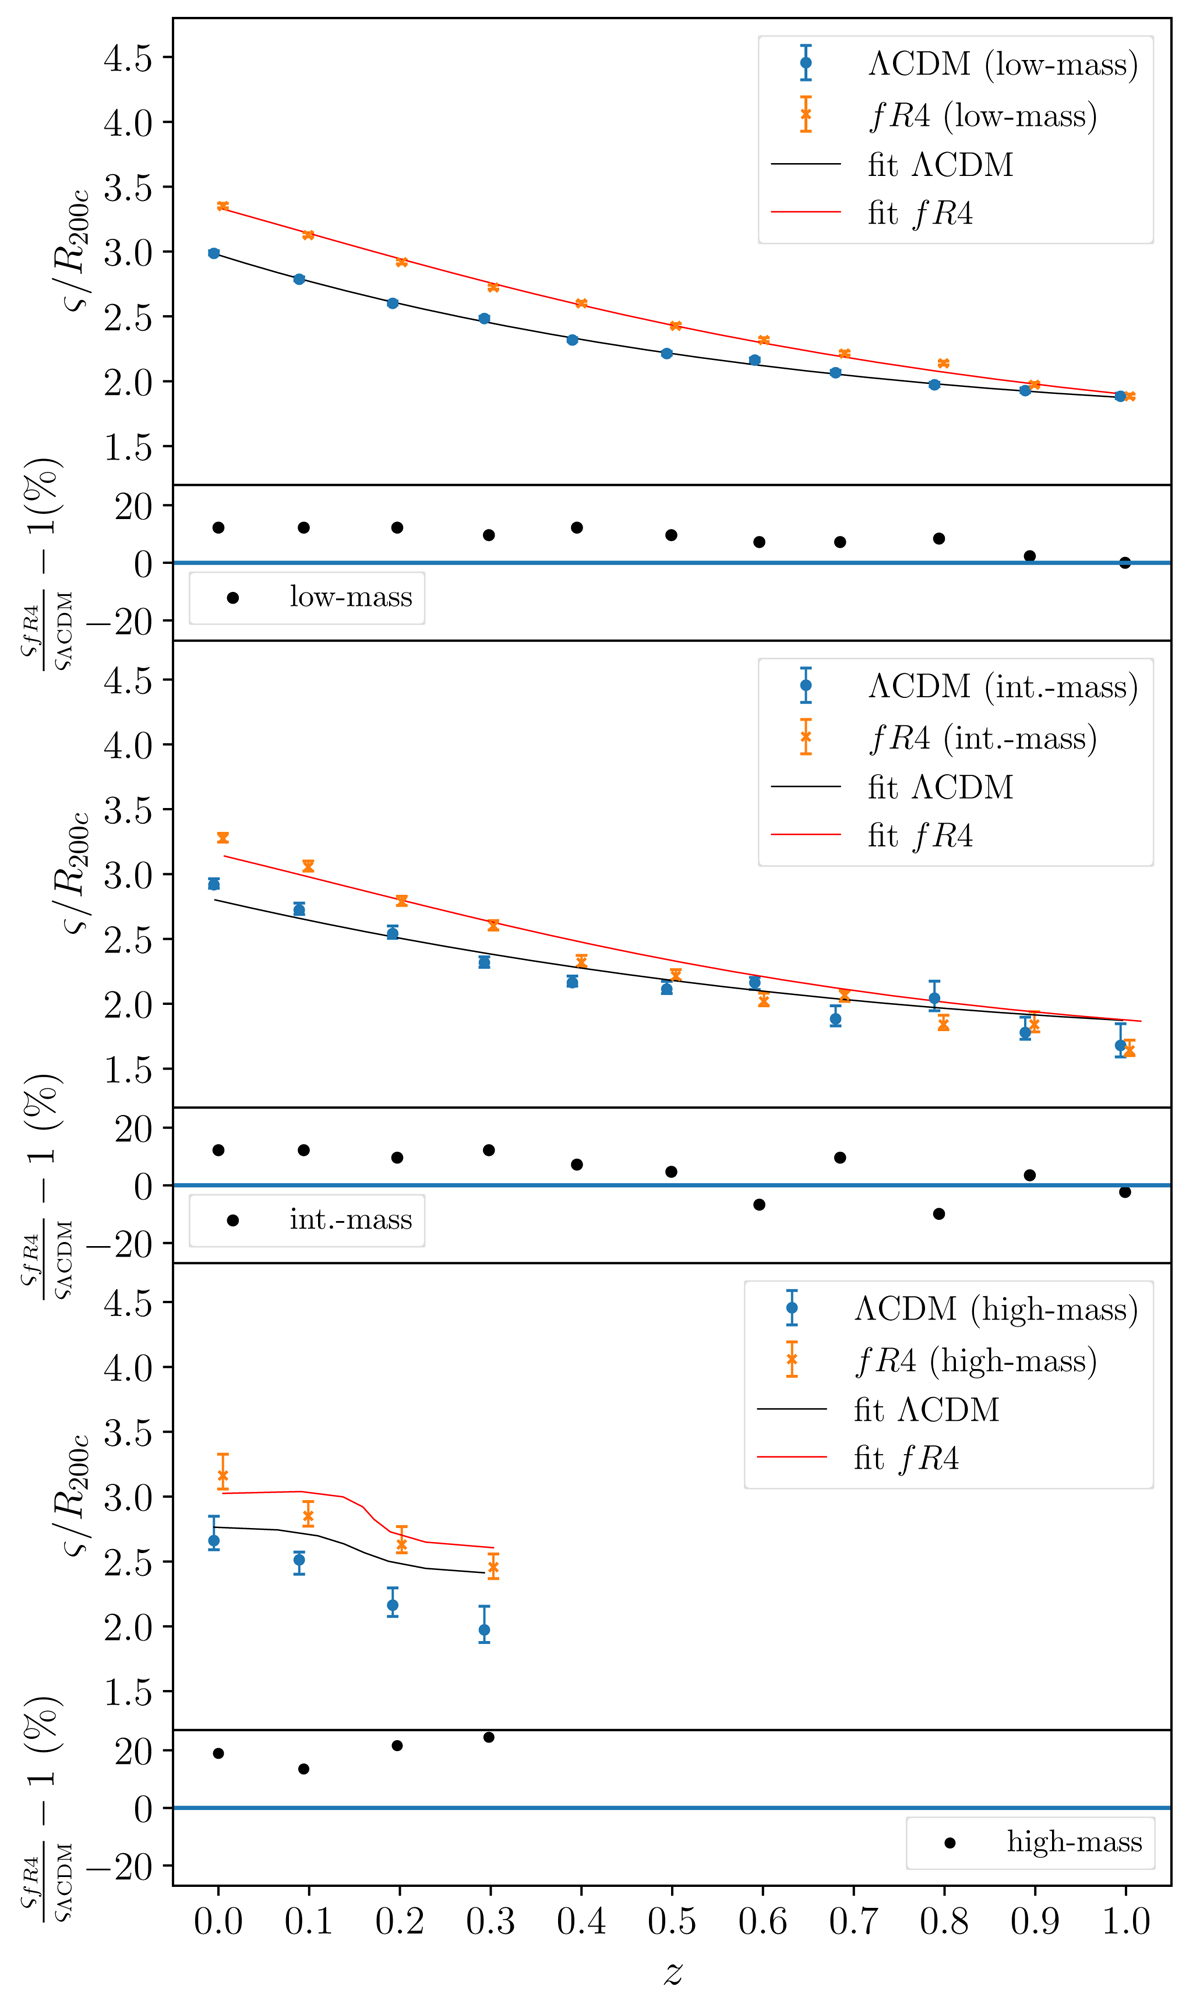
Fig. 3.
Download original image
Medians and associated errors of ς as a function of redshift in ΛCDM (blue points) and fR4 (orange points) for the low- (top panel), intermediate- (middle panel), and high-mass (bottom panel) samples. We applied small redshift offsets to the fR4 points to facilitate comparison. The black (red) lines are the fits of Eq. (4) to the ΛCDM (fR4) points: specifically, the curves are the result of a spline interpolation of the values of ς (11 for the low- and intermediate-mass bin, 4 for the high-mass bin) resulting from Eq. (4) using the redshift, mass, and mass accretion rate of each simulated bin (Table 1). In each panel, the lower plot shows the differences of the median ςs in ΛCDM and fR4 relative to the ΛCDM value.
Current usage metrics show cumulative count of Article Views (full-text article views including HTML views, PDF and ePub downloads, according to the available data) and Abstracts Views on Vision4Press platform.
Data correspond to usage on the plateform after 2015. The current usage metrics is available 48-96 hours after online publication and is updated daily on week days.
Initial download of the metrics may take a while.