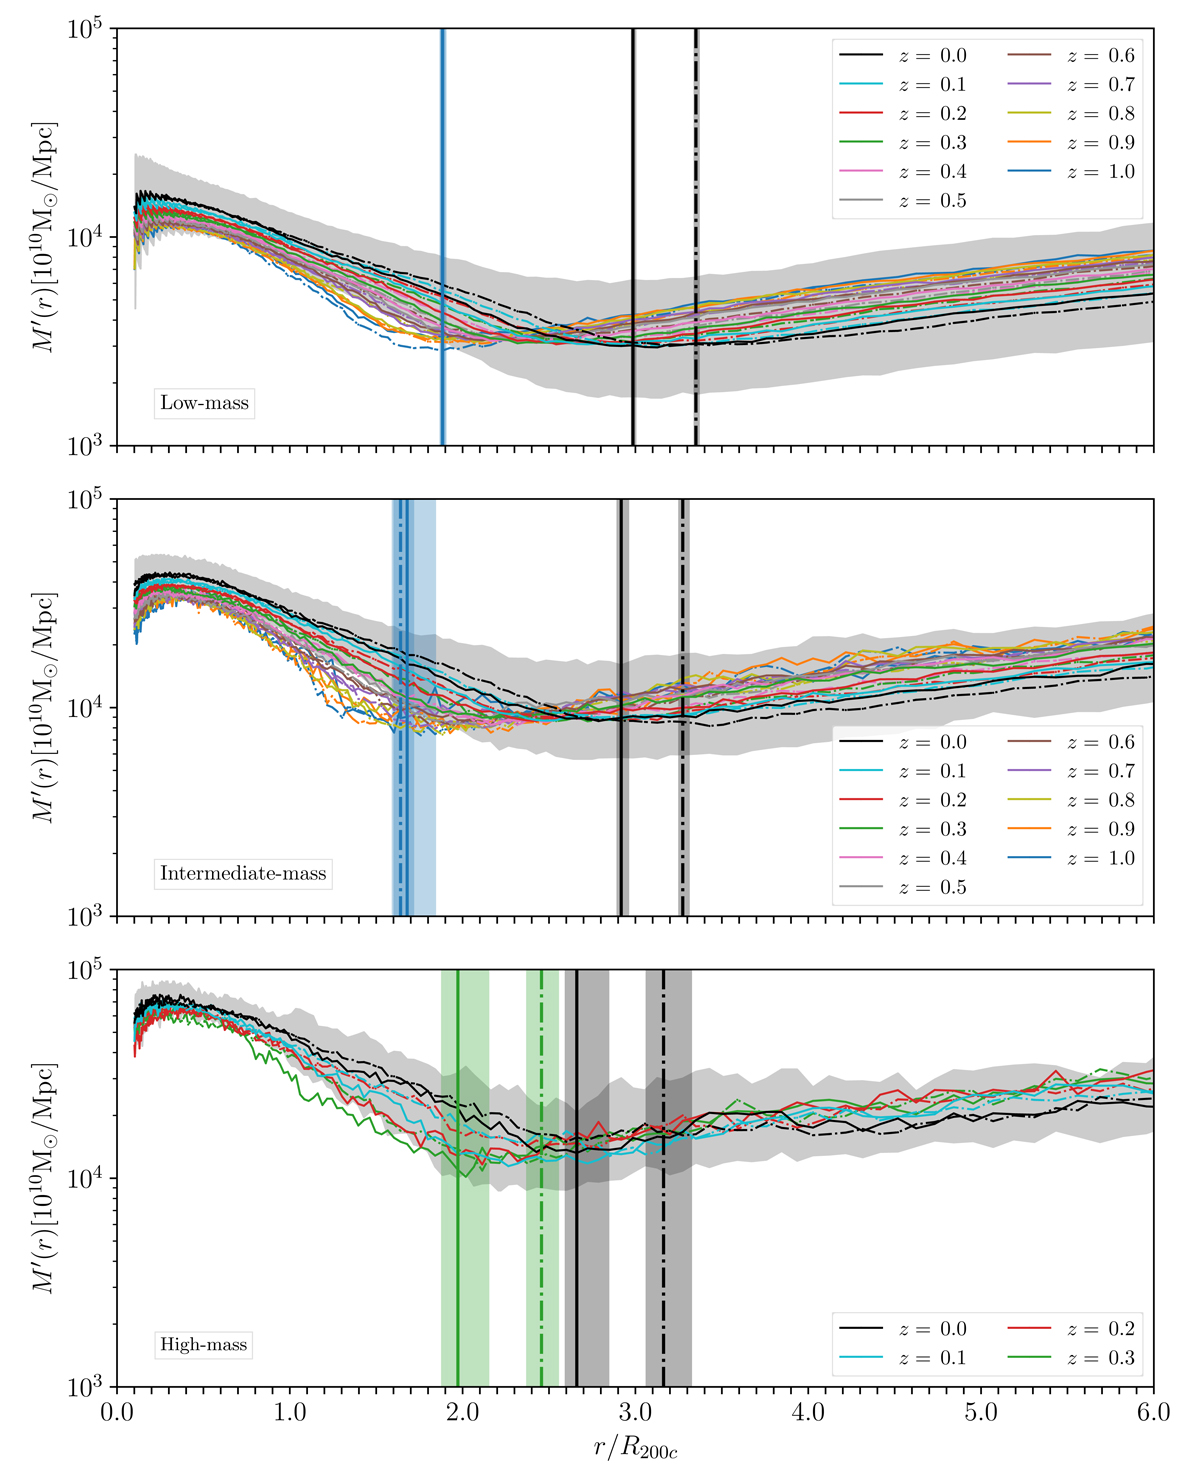
Fig. 2.
Download original image
Median differential radial mass profiles of the samples of the simulated halos in Table 1. The top, middle, and bottom panels show the results for the low-, intermediate-, and high-mass samples, respectively. The solid (dash-dotted) curves are the median profiles for the ΛCDM (fR4) halos. The profiles of the halos at different redshifts are shown with different colors, as listed in the insets. The shaded gray areas show the 68th percentile range of the distributions of the profiles of the individual halos at z = 0 in the ΛCDM model. The spreads of the profiles at the other redshifts and in the fR4 model are comparable. The vertical thick solid (dash-dotted) black line shows the median radius ς at z = 0 in the ΛCDM (fR4) model. The vertical thick blue (green) lines show ς for the profiles at z = 1.0 (z = 0.3): the solid and dash-dotted lines show the ΛCDM and fR4 models, respectively. The dash-dotted blue line in the upper panel is overplotted on the solid blue line. The vertical stripes indicate the error bands of the median ςs.
Current usage metrics show cumulative count of Article Views (full-text article views including HTML views, PDF and ePub downloads, according to the available data) and Abstracts Views on Vision4Press platform.
Data correspond to usage on the plateform after 2015. The current usage metrics is available 48-96 hours after online publication and is updated daily on week days.
Initial download of the metrics may take a while.