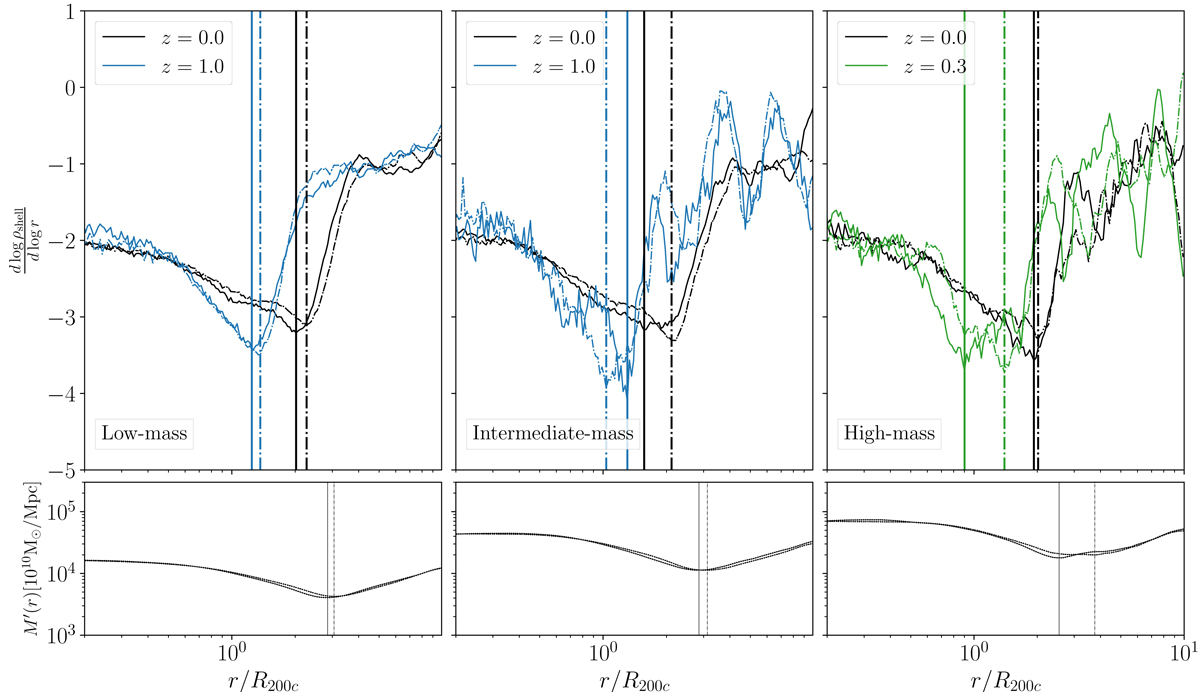
Fig. 1.
Download original image
Logarithmic derivative of the average density profiles, and Rspl as function of mass, redshift, and theory of gravity. Upper panels: average profiles of d log ρshell/d log r for the samples of simulated halos in Table 1. The left, middle, and right panels show the average profiles for the low-, intermediate-, and high-mass samples, respectively, at the lowest and highest redshifts of each sample, as listed in the insets. The solid (dash-dotted) curves are the profiles in the ΛCDM (fR4) model. The vertical solid (dash-dotted) thick black lines show the location of Rspl at z = 0 in the ΛCDM (fR4) model. The pair of vertical blue (green) solid and dash-dotted lines shows Rspl at z = 1.0 (z = 0.3) for the ΛCDM and fR4 models, respectively. Bottom panels: the thin solid (dash-dotted) black curves show the radial derivative of the average mass profile in ΛCDM (fR4) at z = 0; the vertical thin solid (dash-dotted) black lines show ςavg of the low-, intermediate-, and high-mass samples at z = 0 in the ΛCDM (fR4) models (Table 2, first row, values in brackets). When extended to the upper panels, these thin solid and dash-dotted black lines cross the average density profiles at dlog ρshell/d log r ≃ −2, as expected from Eq. (1).
Current usage metrics show cumulative count of Article Views (full-text article views including HTML views, PDF and ePub downloads, according to the available data) and Abstracts Views on Vision4Press platform.
Data correspond to usage on the plateform after 2015. The current usage metrics is available 48-96 hours after online publication and is updated daily on week days.
Initial download of the metrics may take a while.