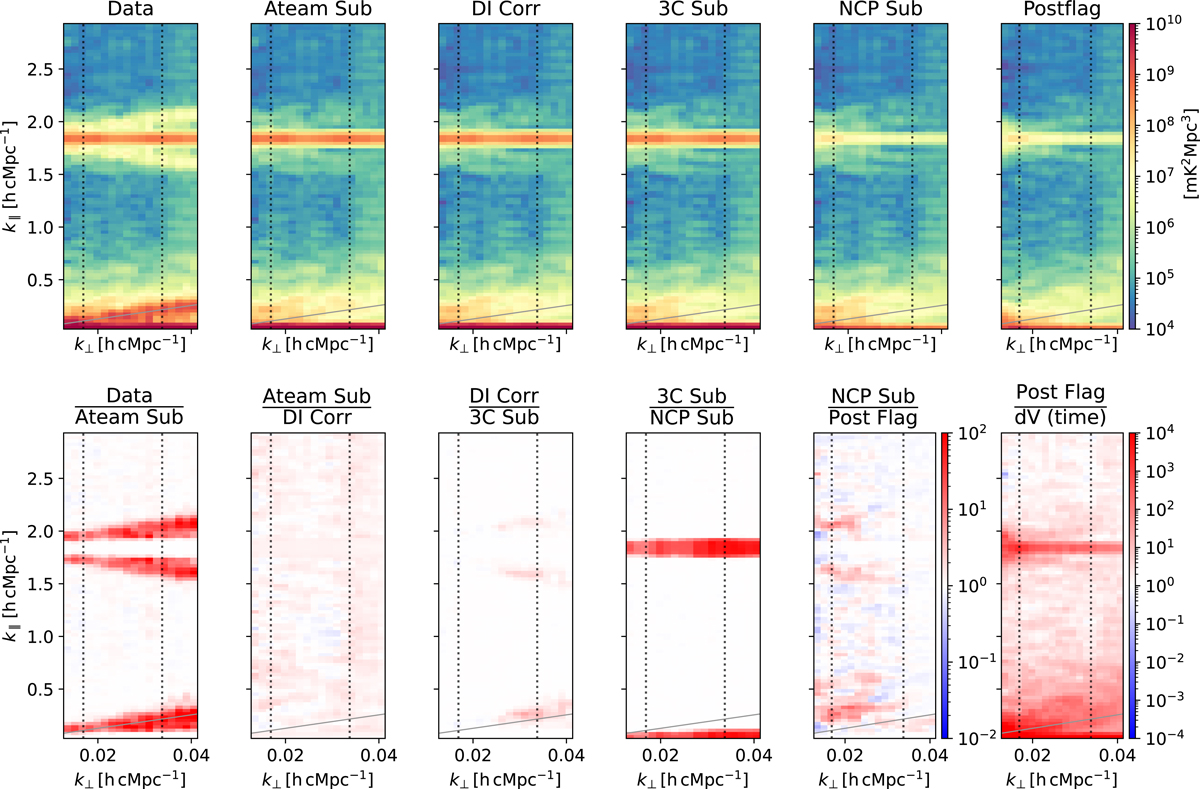
Fig. 9.
Download original image
Cylindrical power spectra at different stages of calibration and source subtraction. Top row: cylindrical power spectra after preprocessing (“Data”), after A-team subtraction (“Ateam Sub”), after DI correction (“DI Corr”), after 3C subtraction (“3C Sub”), after NCP Subtraction (“NCP Sub”), and after post-calibration RFI flagging (“Postflag”). Bottom row: ratio of successive power spectra in the top row. This shows how much power has been subtracted and from which part of the k space at the different calibration stages. The rightmost plot in the bottom row is the ratio of the power spectrum of the data after post-calibration RFI flagging to the noise power spectrum obtained from time-differenced Stokes-V data. Note that the color bars for all plots in the same row are the same, except for the plot on the extreme right in the bottom row.
Current usage metrics show cumulative count of Article Views (full-text article views including HTML views, PDF and ePub downloads, according to the available data) and Abstracts Views on Vision4Press platform.
Data correspond to usage on the plateform after 2015. The current usage metrics is available 48-96 hours after online publication and is updated daily on week days.
Initial download of the metrics may take a while.