Fig. 8.
Download original image
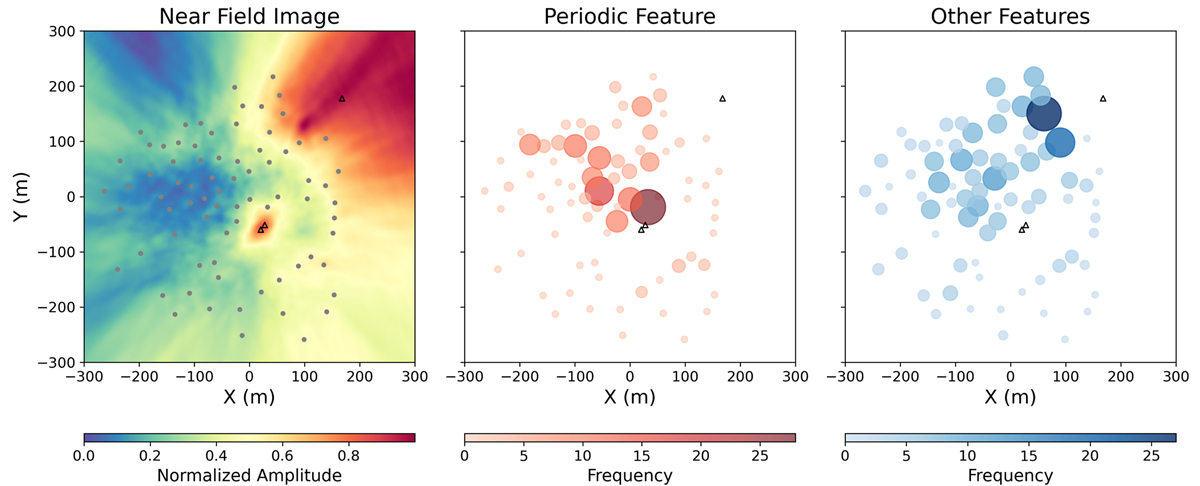
Local RFI sources at the NenuFAR site and their impact on the MAs. Left: normalized near-field image of the data. The locations of the buildings housing the electronic containers are indicated with black triangles, and the MAs are indicated with gray circles. Center: histogram of the MAs contributing to the baselines that exhibit a periodic amplitude fluctuation in time. Right: histogram of the MAs contributing to all other baselines, which have been flagged based on unusual features seen in the delay power spectra. The size and color of the circles in the middle and right panels indicate the number of baselines involving that MA that have been flagged.
Current usage metrics show cumulative count of Article Views (full-text article views including HTML views, PDF and ePub downloads, according to the available data) and Abstracts Views on Vision4Press platform.
Data correspond to usage on the plateform after 2015. The current usage metrics is available 48-96 hours after online publication and is updated daily on week days.
Initial download of the metrics may take a while.