Fig. 6.
Download original image
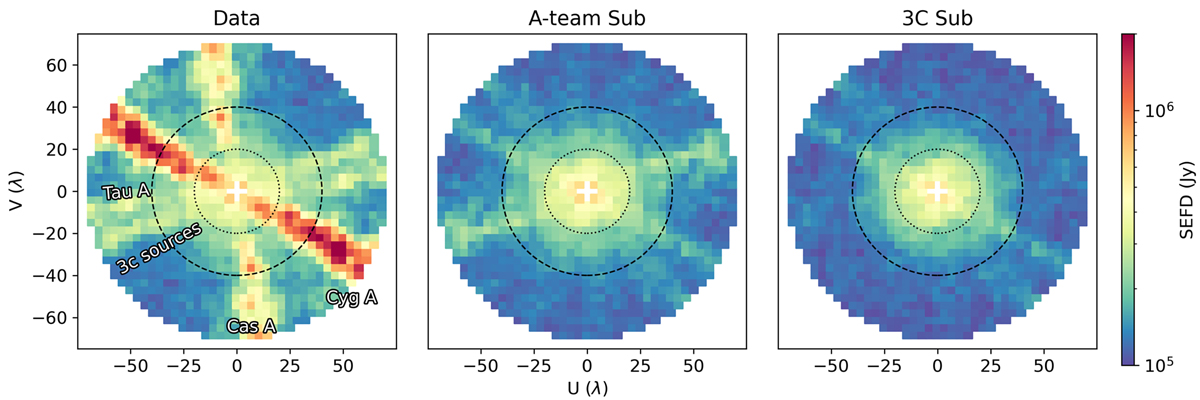
Data standard deviation in SEFD units calculated from the channel-differenced noise at each uv cell of the Stokes-I data cube. The three panels correspond to the data after preprocessing (left), after A-team subtraction (middle), and after 3C subtraction (right). The dotted and dashed circles correspond to the 20λ and 40λ limits, respectively, between which the power spectrum is finally computed.
Current usage metrics show cumulative count of Article Views (full-text article views including HTML views, PDF and ePub downloads, according to the available data) and Abstracts Views on Vision4Press platform.
Data correspond to usage on the plateform after 2015. The current usage metrics is available 48-96 hours after online publication and is updated daily on week days.
Initial download of the metrics may take a while.