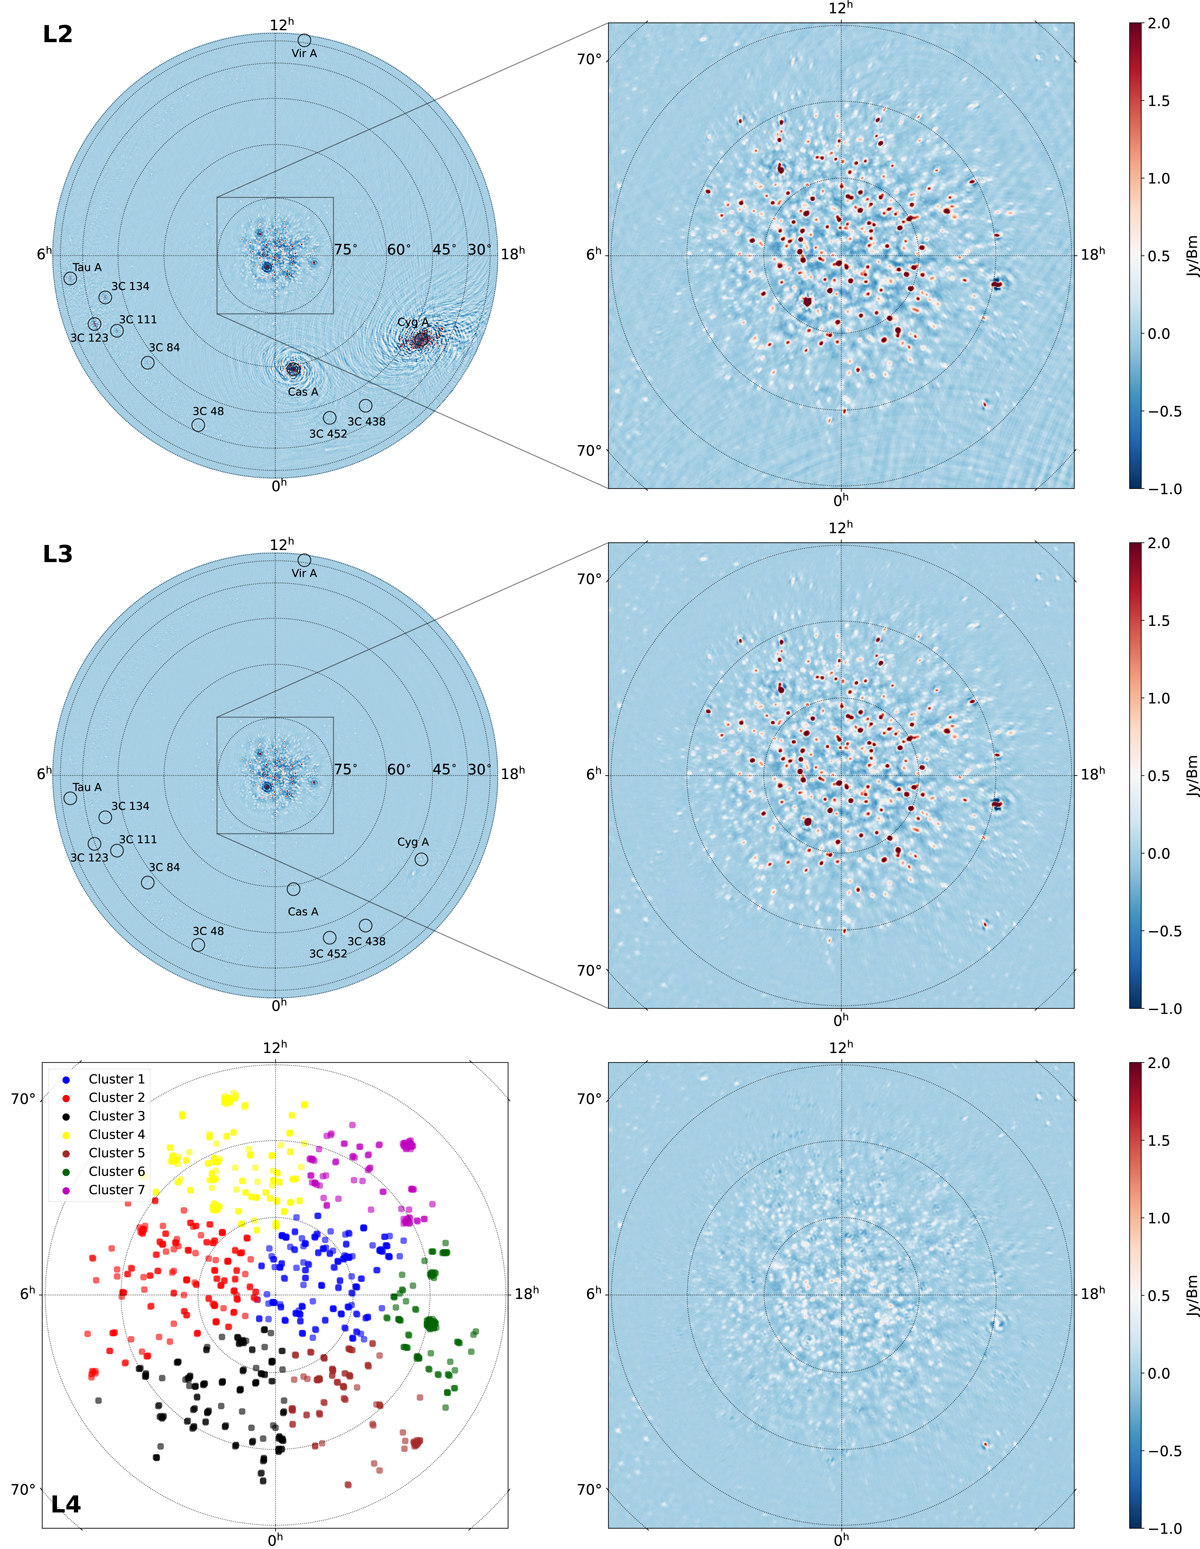
Fig. 5.
Download original image
Images of the L2, L3, and L4 data. Top: wide-field dirty image (left) and narrow-field cleaned image (right) of the L2 data. Middle: same but for the L3 data. Bottom left: the seven clusters that the sky model is divided into for the NCP subtraction step. Bottom right: narrow-field cleaned image of the L4 data.
Current usage metrics show cumulative count of Article Views (full-text article views including HTML views, PDF and ePub downloads, according to the available data) and Abstracts Views on Vision4Press platform.
Data correspond to usage on the plateform after 2015. The current usage metrics is available 48-96 hours after online publication and is updated daily on week days.
Initial download of the metrics may take a while.