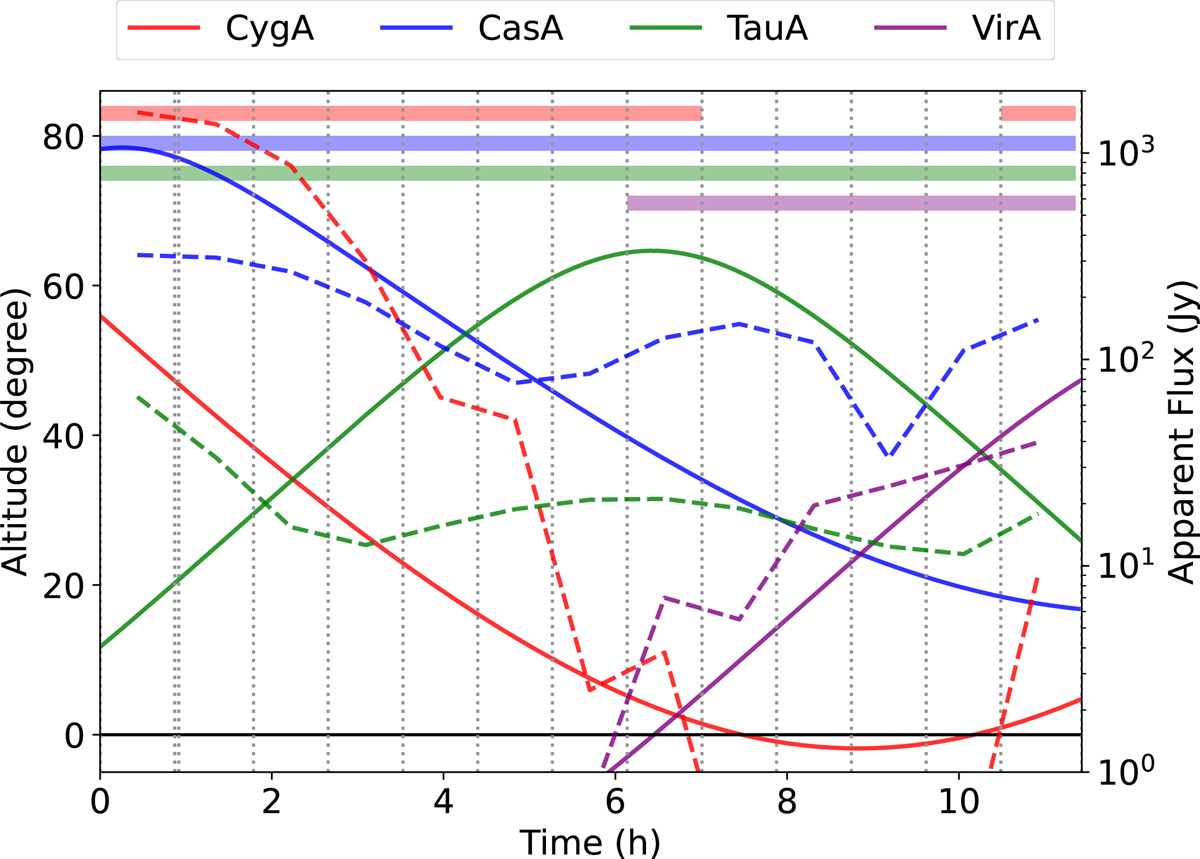
Fig. 4.
Download original image
Altitude- and beam-attenuated flux values for the four A-team sources, Cyg A, Cas A, Tau A, and Vir A, that are subtracted in the analysis. The vertical dotted lines demarcate the 13 different segments into which the data are divided. The solid lines indicate the altitude of the A-team and are to be read using the scale on the left-hand side axis. The dashed lines connect the intrinsic flux values for the A-team attenuated by the averaged preliminary primary beam model value for each data segment and are to be read using the axis on the right-hand side. The four horizontal bands on top indicate the data segments in which each A-team was included in the sky model and hence subtracted through the method described in Sect. 4.1.1.
Current usage metrics show cumulative count of Article Views (full-text article views including HTML views, PDF and ePub downloads, according to the available data) and Abstracts Views on Vision4Press platform.
Data correspond to usage on the plateform after 2015. The current usage metrics is available 48-96 hours after online publication and is updated daily on week days.
Initial download of the metrics may take a while.