Fig. B.2.
Download original image
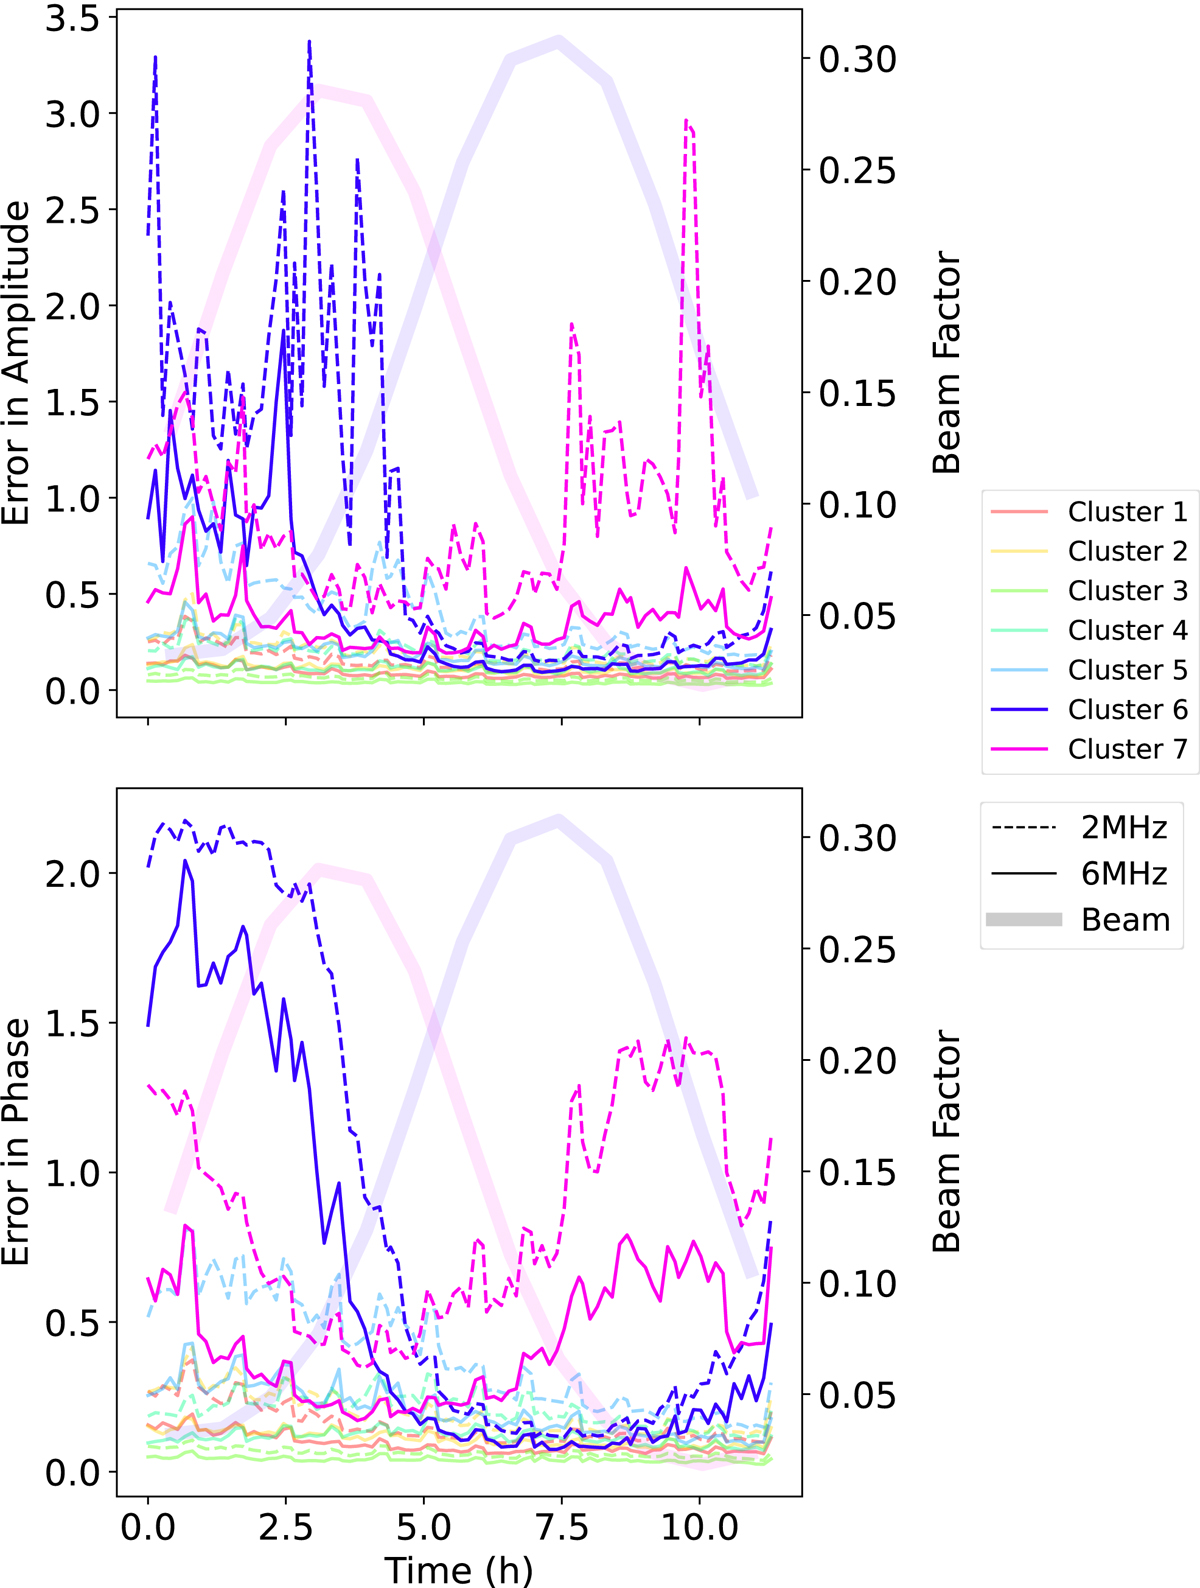
Gain calibration errors at the NCP subtraction step. The top and bottom panels show the errors in the amplitude and phase of the gain solutions, respectively. The dashed lines correspond to the solutions obtained using 2 MHz smoothing while the solid lines correspond to those obtained using 6 MHz smoothing. The thick solid lines show the beam factor and are to be read using the vertical axis on the right-hand side. The different colors refer to the gains in the direction of the different clusters.
Current usage metrics show cumulative count of Article Views (full-text article views including HTML views, PDF and ePub downloads, according to the available data) and Abstracts Views on Vision4Press platform.
Data correspond to usage on the plateform after 2015. The current usage metrics is available 48-96 hours after online publication and is updated daily on week days.
Initial download of the metrics may take a while.