Fig. 17.
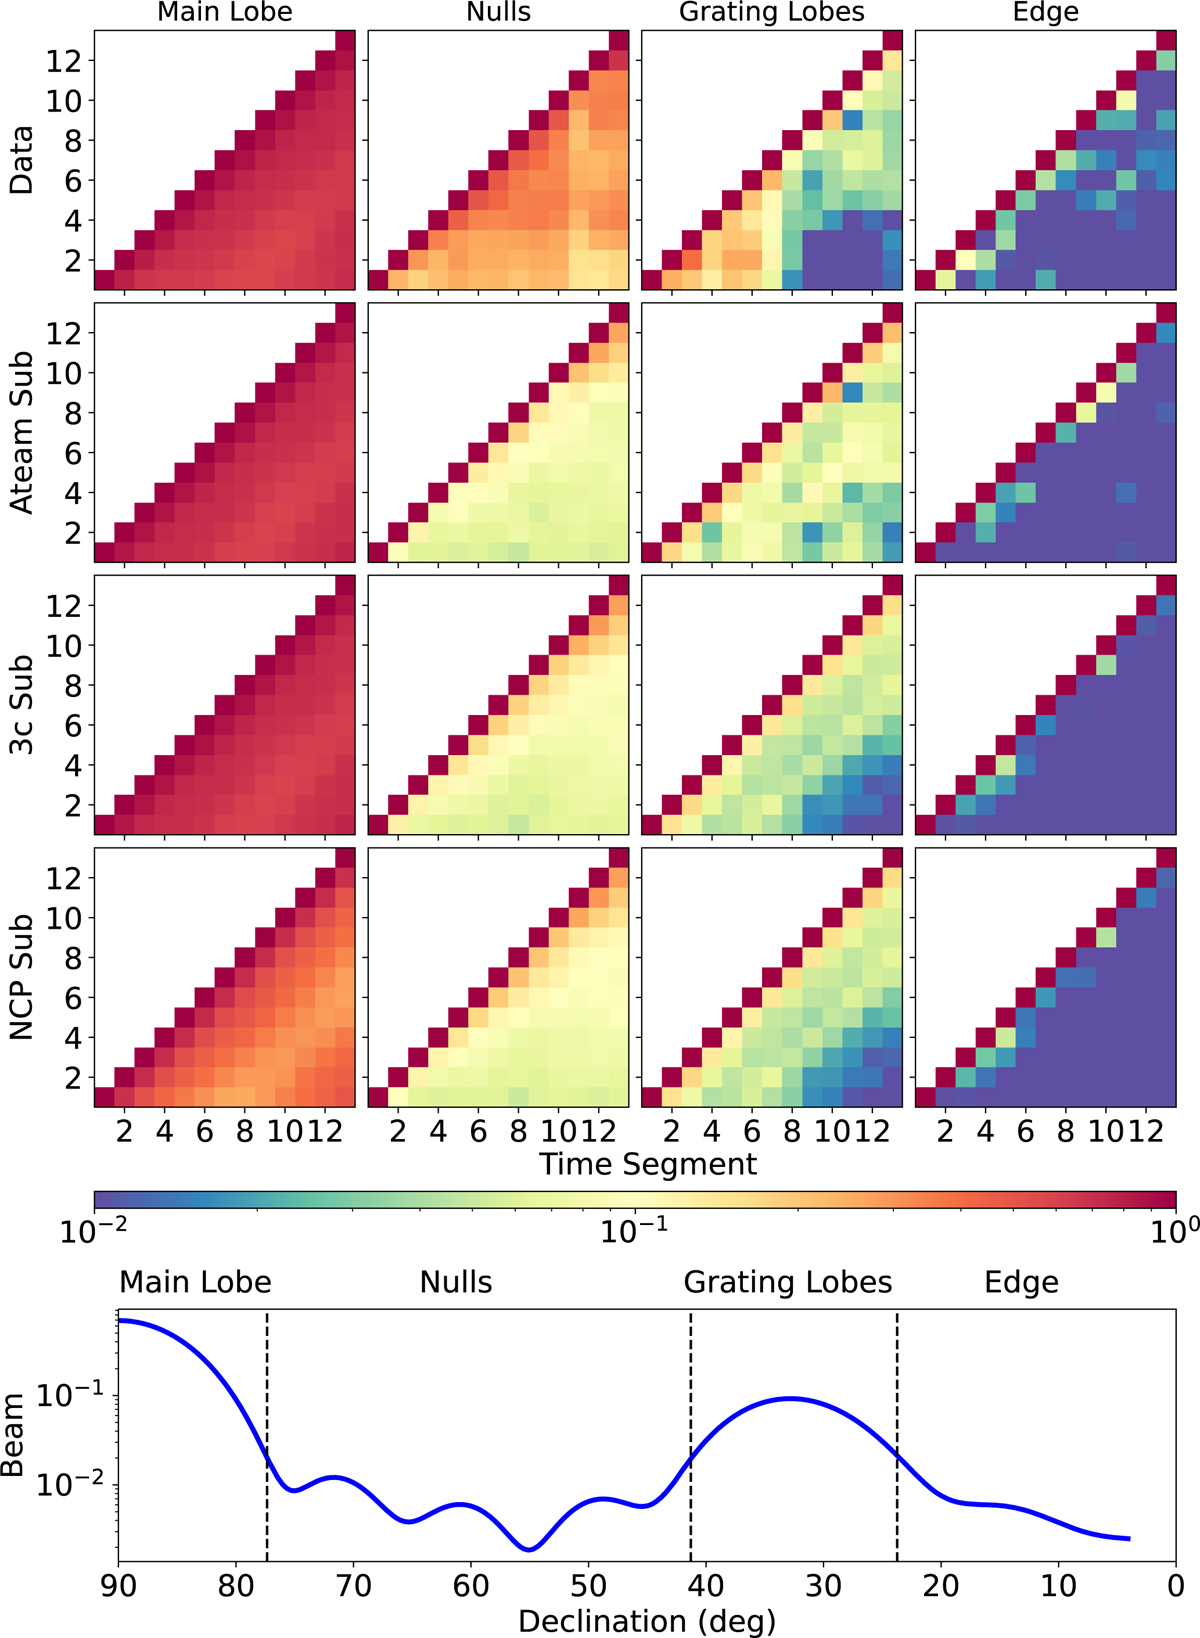
Download original image
Cross-coherence of the data between different time segments. The top panel shows the cross-coherence computed in four different regions of the primary beam (different columns), for the data at four different stages of sky model subtraction (different rows). The bottom panel shows what the four regions correspond to in the radial profile of the time-averaged primary beam.
Current usage metrics show cumulative count of Article Views (full-text article views including HTML views, PDF and ePub downloads, according to the available data) and Abstracts Views on Vision4Press platform.
Data correspond to usage on the plateform after 2015. The current usage metrics is available 48-96 hours after online publication and is updated daily on week days.
Initial download of the metrics may take a while.