Fig. 15.
Download original image
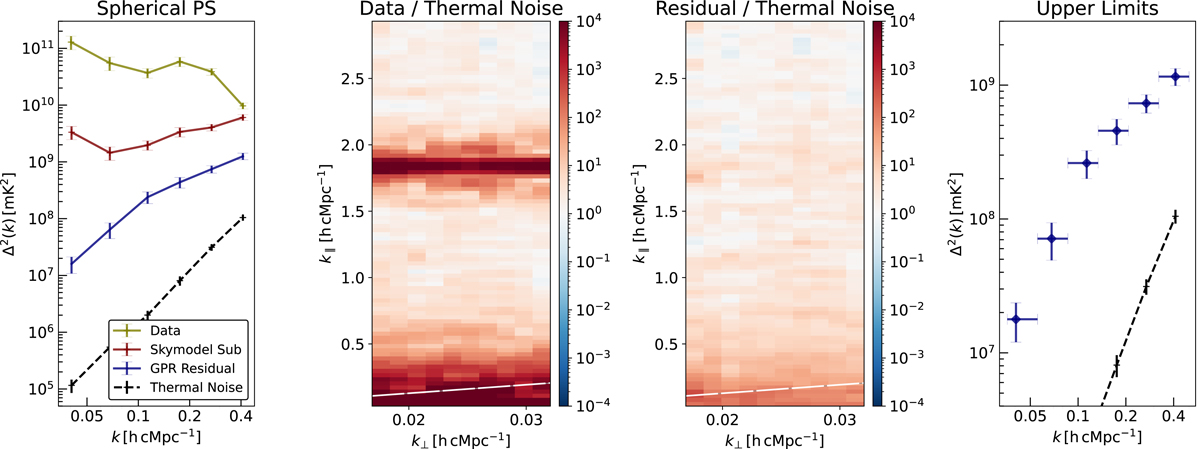
Spherical and cylindrical power spectra at some key stages of the analysis pipeline. The left-most panel shows the spherical power spectra after preprocessing (“Data”), after sky model subtraction (“Skymodel Sub”), and after GPR (“GPR Residual”), along with the thermal noise power spectrum (“Thermal Noise”). For the cylindrical power spectra (second and third panels), the ratio with respect to the thermal noise power spectrum is shown. The white dashed lines indicate the horizon limit. The spherical power spectra after noise bias subtraction and suppression factor correction are shown in the rightmost panel.
Current usage metrics show cumulative count of Article Views (full-text article views including HTML views, PDF and ePub downloads, according to the available data) and Abstracts Views on Vision4Press platform.
Data correspond to usage on the plateform after 2015. The current usage metrics is available 48-96 hours after online publication and is updated daily on week days.
Initial download of the metrics may take a while.