Fig. 14.
Download original image
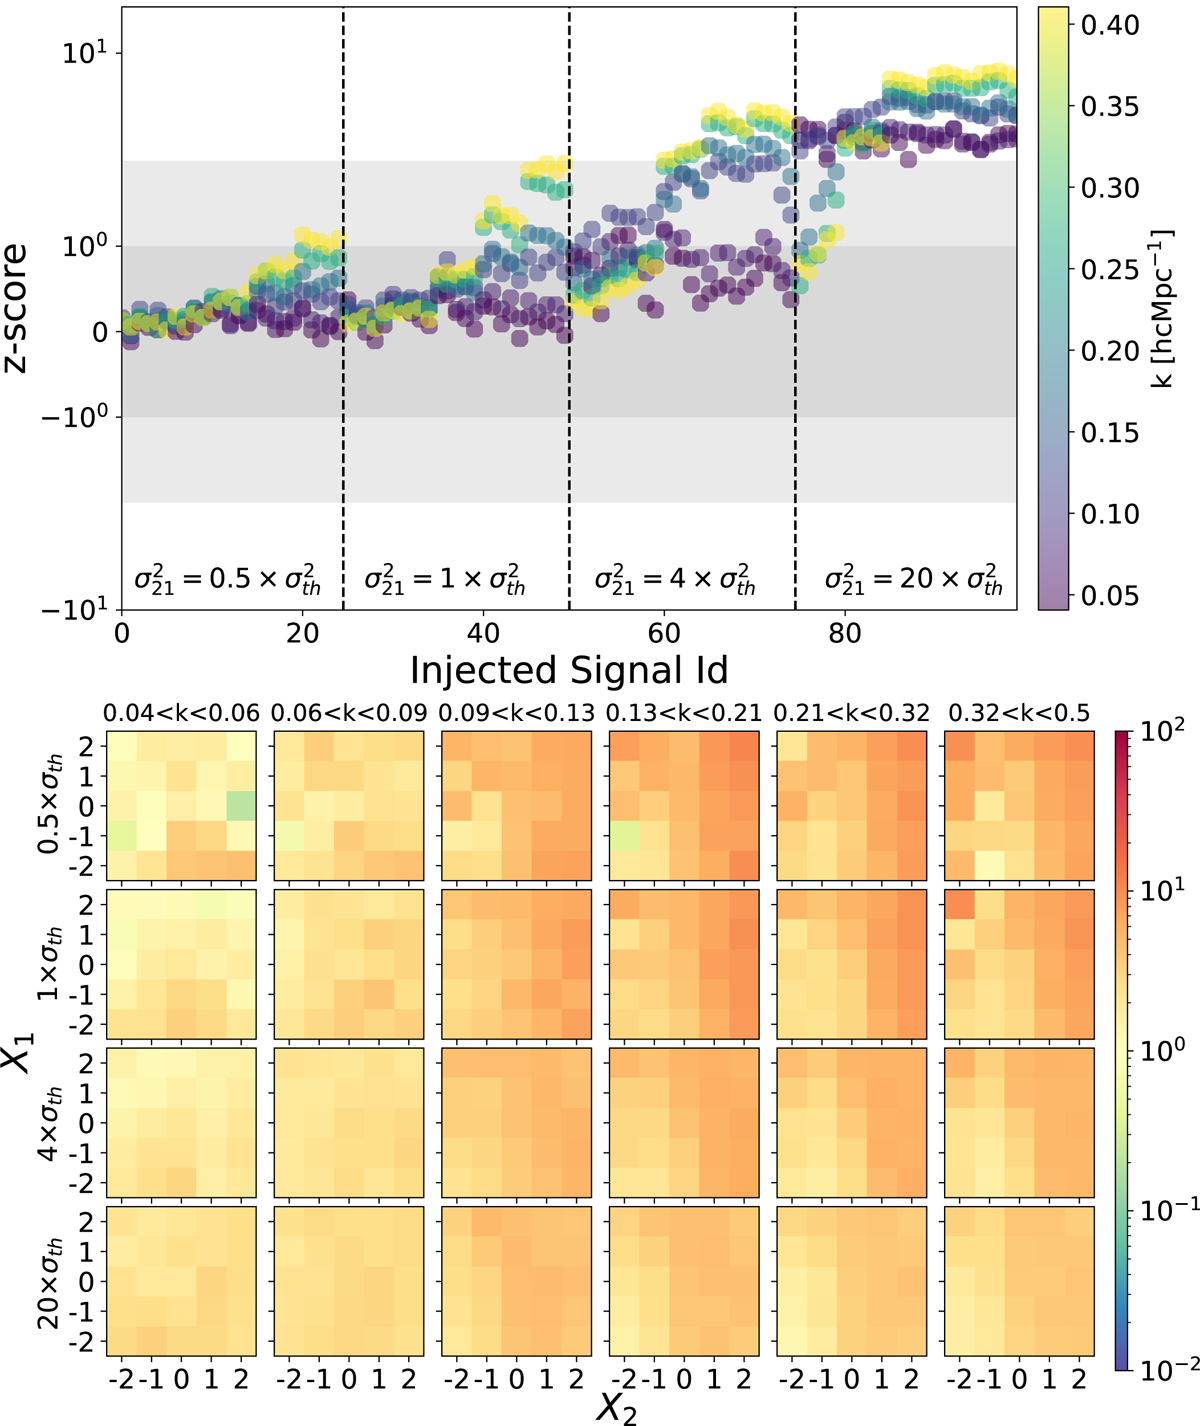
Results of the robustness tests performed on the ML-GPR step. Top: z-score for all injected signals at the different k bins. The vertical dashed lines demarcate the different strengths of the injected signals. The horizontal gray bands indicate the 1-sigma and 2-sigma levels. Bottom: Bias for all injected signals at the different k bins. The 25 cells in each panel correspond to the 25 different shapes of the injected signal. The different rows correspond to the different strengths of the injected signal and the different columns show the results in different k bins. The color scale indicates the value of the bias in each case.
Current usage metrics show cumulative count of Article Views (full-text article views including HTML views, PDF and ePub downloads, according to the available data) and Abstracts Views on Vision4Press platform.
Data correspond to usage on the plateform after 2015. The current usage metrics is available 48-96 hours after online publication and is updated daily on week days.
Initial download of the metrics may take a while.