Fig. 13.
Download original image
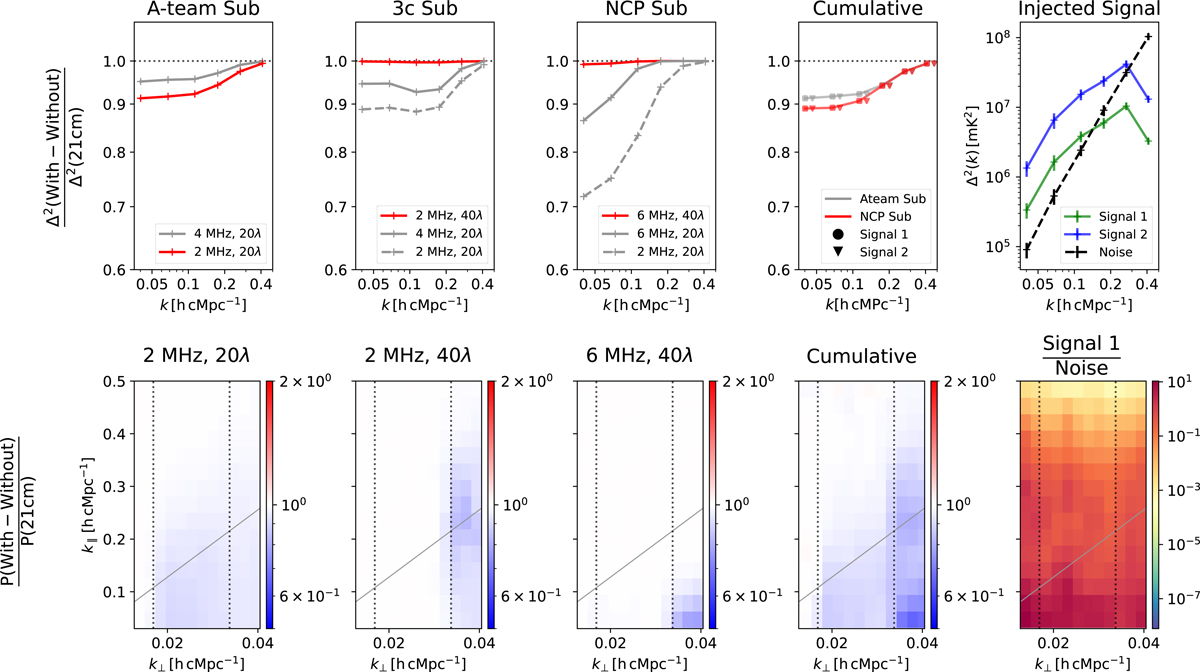
Results of the robustness tests performed on different steps of the calibration pipeline. The results of the tests on the three DD calibration steps for different smoothing kernel widths and baseline cuts are presented in the first three columns from the left. The top row shows the suppression factor in the spherical power spectra for the different steps. The lines in red correspond to the settings that were used for the final analysis, and the plots in the bottom row show the suppression factor in the cylindrical power spectra corresponding to these settings. The vertical dotted lines in the bottom row correspond to the 20λ and 40λ cuts and the region between these two lines is used for constructing the final spherical PS. The fourth column from the left shows the cumulative suppression of a signal injected into the L2 data. The top panel shows the cumulative signal suppression after A-team subtraction and after NCP subtraction for the injected 21 cm signal scaled by a factor of 1000 (Signal 1: circles) and 2000 (Signal 2: inverted triangles). The inverted triangle markers have been shifted horizontally for visual clarity. The rightmost column presents the spherical (top) and cylindrical (bottom) power spectra of the injected signal and their comparison with the noise power spectra.
Current usage metrics show cumulative count of Article Views (full-text article views including HTML views, PDF and ePub downloads, according to the available data) and Abstracts Views on Vision4Press platform.
Data correspond to usage on the plateform after 2015. The current usage metrics is available 48-96 hours after online publication and is updated daily on week days.
Initial download of the metrics may take a while.