Fig. 12.
Download original image
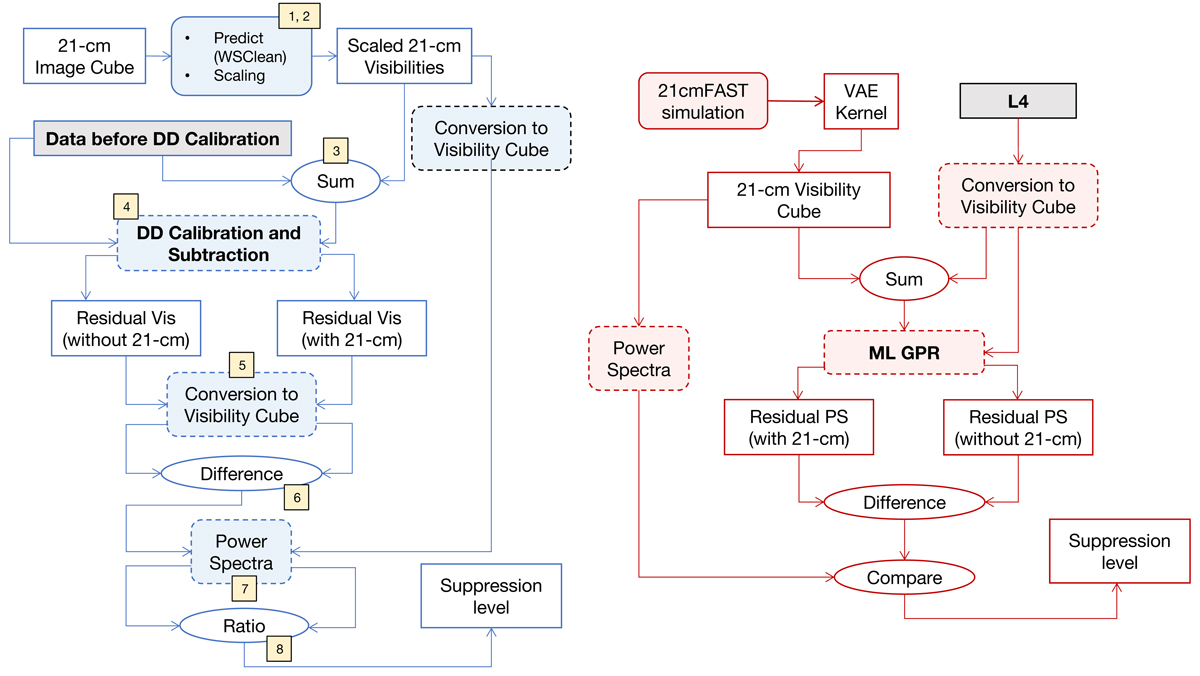
Flowchart for the signal injection tests performed on a DD calibration and subtraction step (outlined in blue), and on ML-GPR (outlined in red). The numbers refer to the sequence of steps described in the text in Sect. 8.1.
Current usage metrics show cumulative count of Article Views (full-text article views including HTML views, PDF and ePub downloads, according to the available data) and Abstracts Views on Vision4Press platform.
Data correspond to usage on the plateform after 2015. The current usage metrics is available 48-96 hours after online publication and is updated daily on week days.
Initial download of the metrics may take a while.