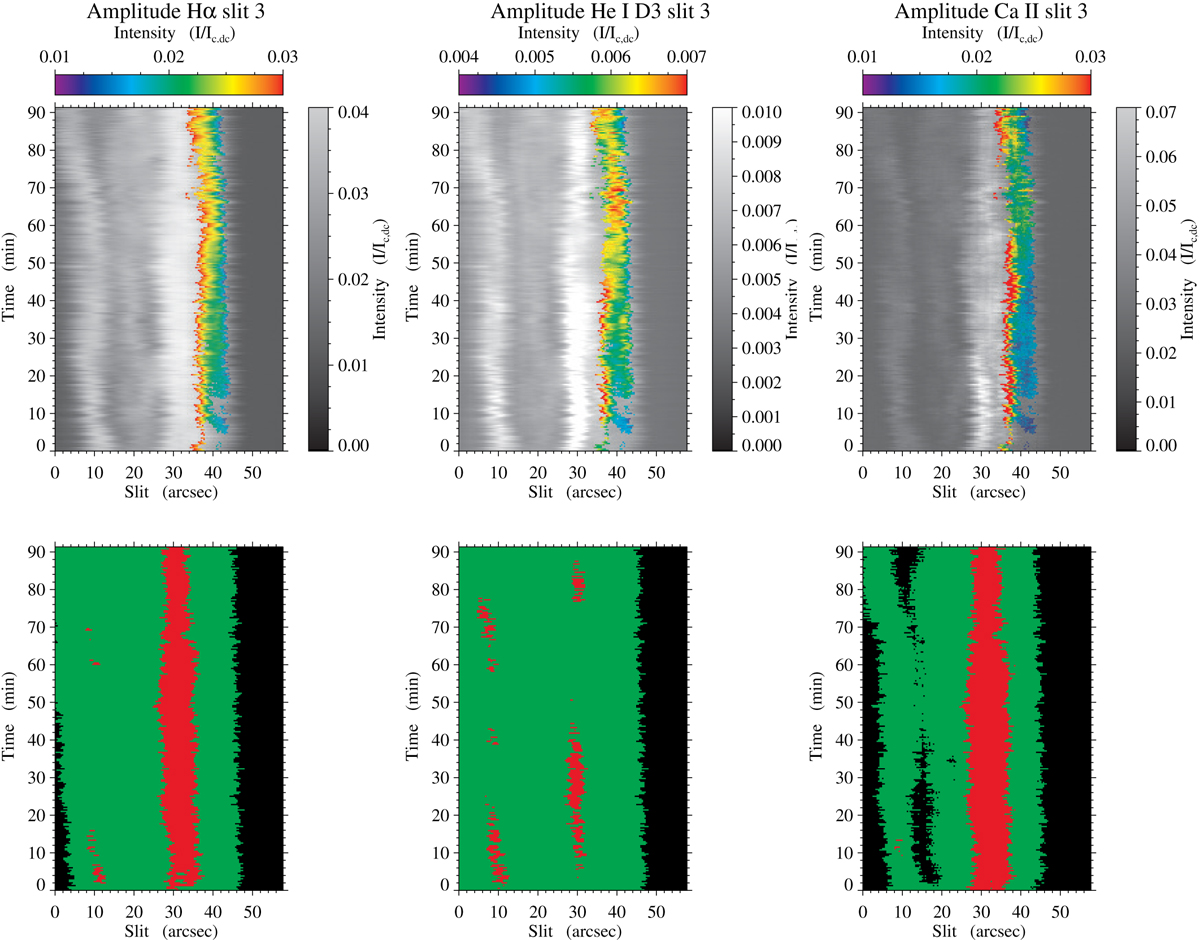
Fig. 5.
Download original image
Time-slit intensity maps and the optically thin criteria for different spectral lines. Top: in grey, time-slit maps of the maximum intensity in the three observed spectral lines for the scan position number 3, Hα (left), He I D3 (centre), and Ca II IR (right). In colour, the optically thin pixels with regular symmetric profiles used for the analysis. Bottom: same time-slit maps with the criterion by Zapiór et al. (2022) to define points that are optically thin (green) or thick (red). The black region represents the very small amplitudes rejected for the analysis.
Current usage metrics show cumulative count of Article Views (full-text article views including HTML views, PDF and ePub downloads, according to the available data) and Abstracts Views on Vision4Press platform.
Data correspond to usage on the plateform after 2015. The current usage metrics is available 48-96 hours after online publication and is updated daily on week days.
Initial download of the metrics may take a while.