Fig. 4.
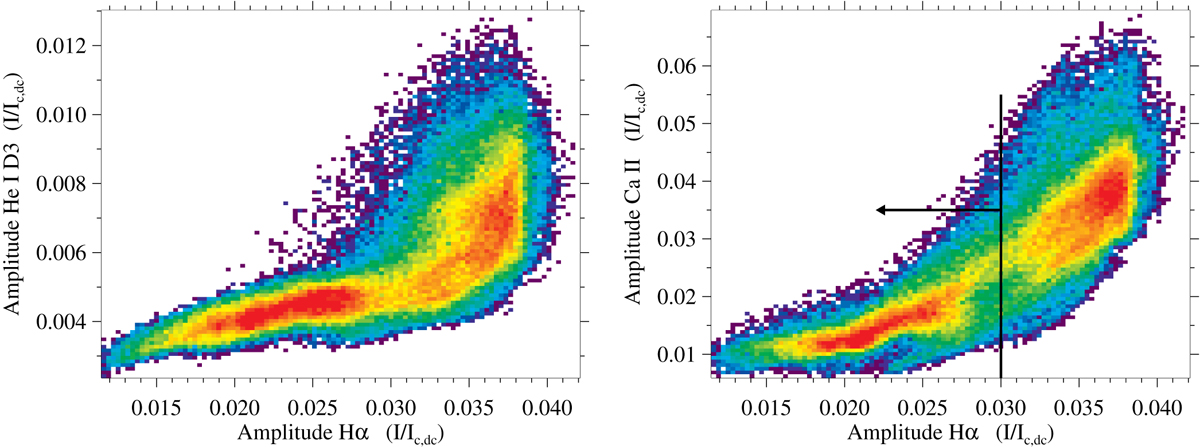
Download original image
Two separate two-dimensional histograms illustrating dependencies between the amplitudes of different spectral lines. The dependence between the amplitudes of Hα and He I D3 is shown in the left panel, whereas the right panel depicts the dependence between the amplitudes of Hα and Ca II IR. All amplitudes are normalised to the corresponding local continuum at disk centre. Redder colors indicate a larger density of points, while bluer colors indicate a smaller density. A linear relationship exists in both plots for Hα normalised amplitudes below 0.03. The arrow indicates the interval considered as optically thin for the analysis (see Sect. 3.1).
Current usage metrics show cumulative count of Article Views (full-text article views including HTML views, PDF and ePub downloads, according to the available data) and Abstracts Views on Vision4Press platform.
Data correspond to usage on the plateform after 2015. The current usage metrics is available 48-96 hours after online publication and is updated daily on week days.
Initial download of the metrics may take a while.