Fig. 12.
Download original image
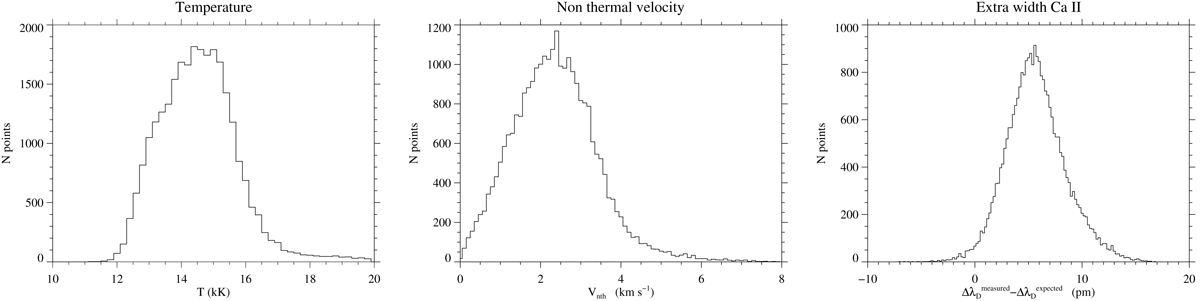
Distribution of kinetic temperatures (left) and non-thermal Doppler width (centre) derived from the Hα and He I D3 spectral lines in all selected points using Eq. (3). With these parameters, the expected Doppler width has been calculated for the Ca II IR spectral line at every point and the excess (measured minus expected) non-thermal velocities histogram is presented (right).
Current usage metrics show cumulative count of Article Views (full-text article views including HTML views, PDF and ePub downloads, according to the available data) and Abstracts Views on Vision4Press platform.
Data correspond to usage on the plateform after 2015. The current usage metrics is available 48-96 hours after online publication and is updated daily on week days.
Initial download of the metrics may take a while.