Open Access
Fig. 1.
Download original image
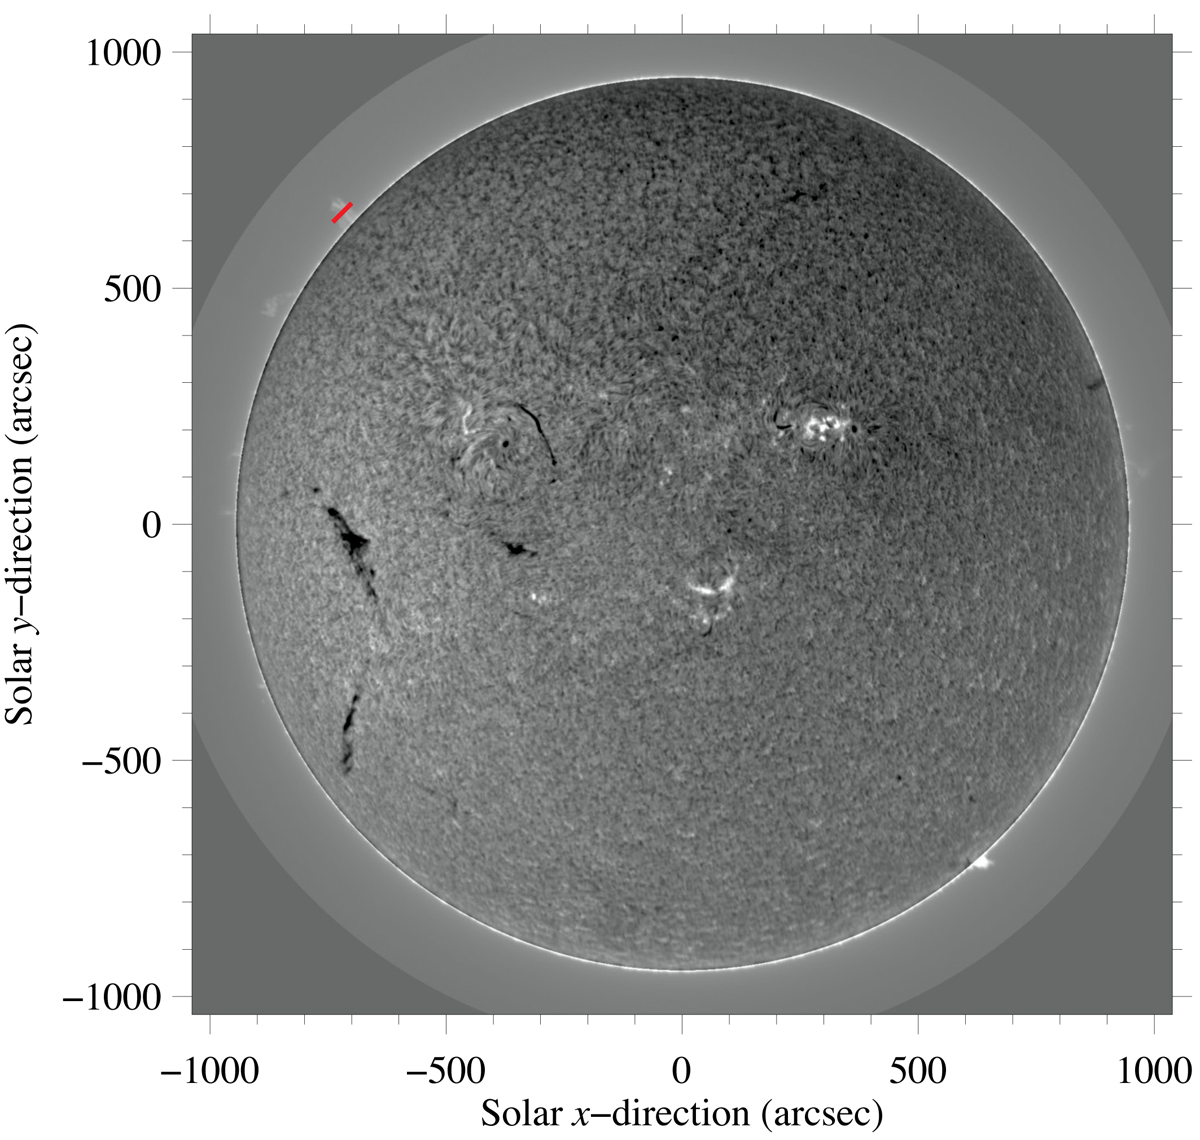
ChroTel Hα filtergram taken on June 17, 2017 at 09:51 UT during the spectroscopic observations. The red line on the north-east (upper left) limb depicts the slit position of the echelle spectrograph. A limb darkening correction has been applied to the image.
Current usage metrics show cumulative count of Article Views (full-text article views including HTML views, PDF and ePub downloads, according to the available data) and Abstracts Views on Vision4Press platform.
Data correspond to usage on the plateform after 2015. The current usage metrics is available 48-96 hours after online publication and is updated daily on week days.
Initial download of the metrics may take a while.