Open Access
Fig. 7
Download original image
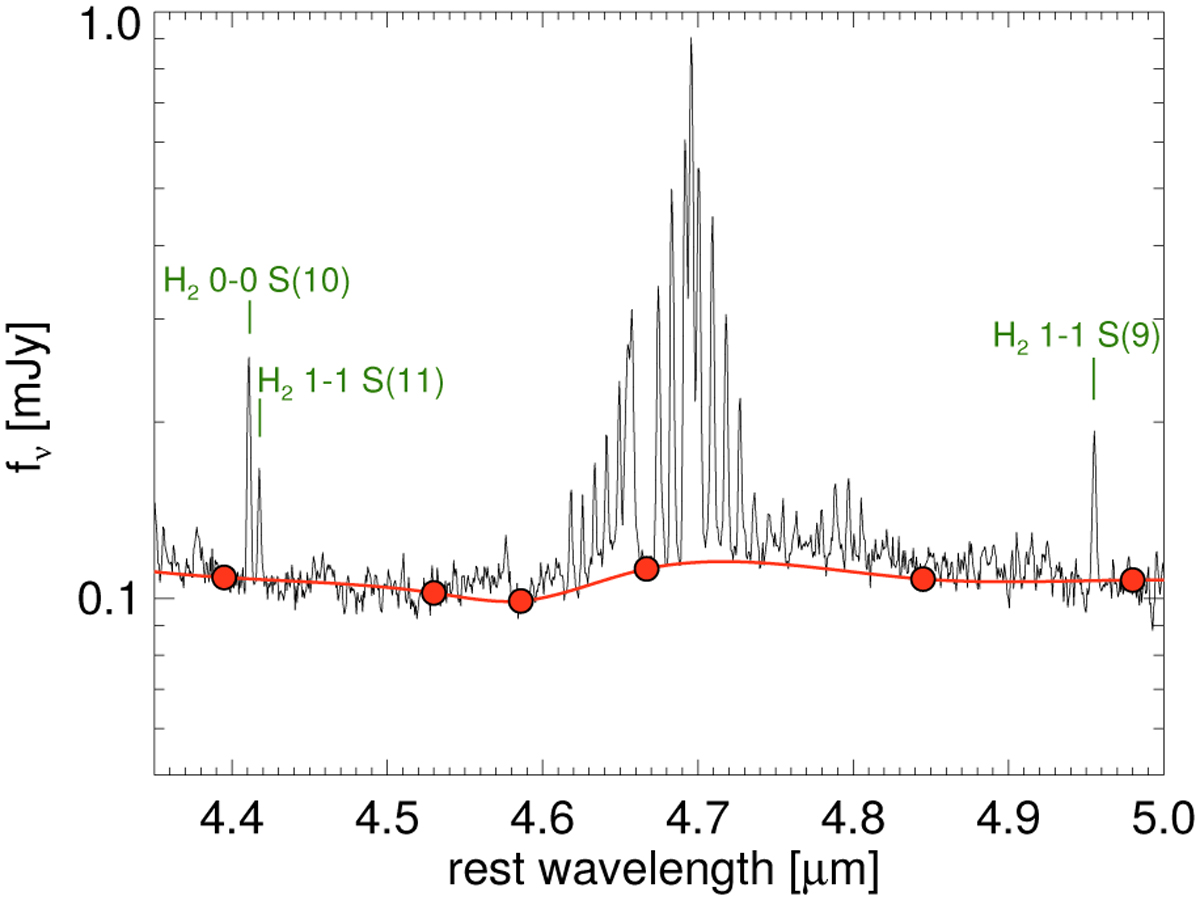
Spectrum from region N3 (black line) and the spline-interpolated continuum baseline (red line). The pivot points are indicated by the red circles (see Sect. 3.3.1). The wavelengths of the three H2 transitions not presented in Figs. 3 and 8 are indicated in green (see also Table 1).
Current usage metrics show cumulative count of Article Views (full-text article views including HTML views, PDF and ePub downloads, according to the available data) and Abstracts Views on Vision4Press platform.
Data correspond to usage on the plateform after 2015. The current usage metrics is available 48-96 hours after online publication and is updated daily on week days.
Initial download of the metrics may take a while.