Fig. 5
Download original image
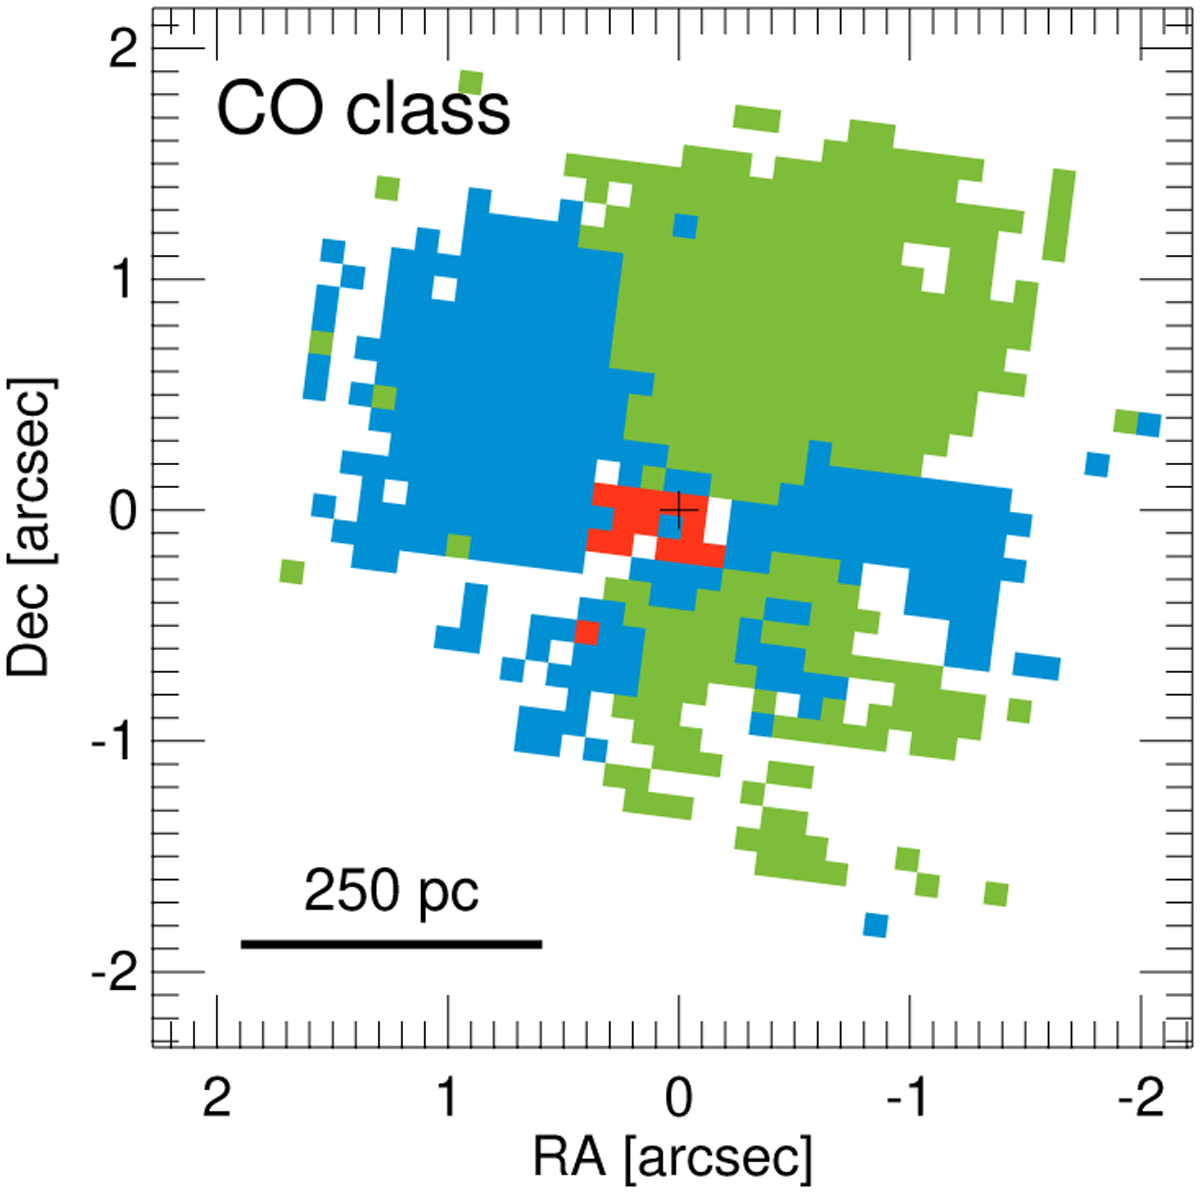
Classification of the CO υ = 1–0 band according to the absorption or emission of the P- and R-branches. The red area marks regions with both branches in absorption. The blue area indicates regions where the R-branch is in absorption and the P-branch in emission. The green areas are regions with both branches in emission. The spectra of these areas are presented in Fig. 3.
Current usage metrics show cumulative count of Article Views (full-text article views including HTML views, PDF and ePub downloads, according to the available data) and Abstracts Views on Vision4Press platform.
Data correspond to usage on the plateform after 2015. The current usage metrics is available 48-96 hours after online publication and is updated daily on week days.
Initial download of the metrics may take a while.