Fig. 4.
Download original image
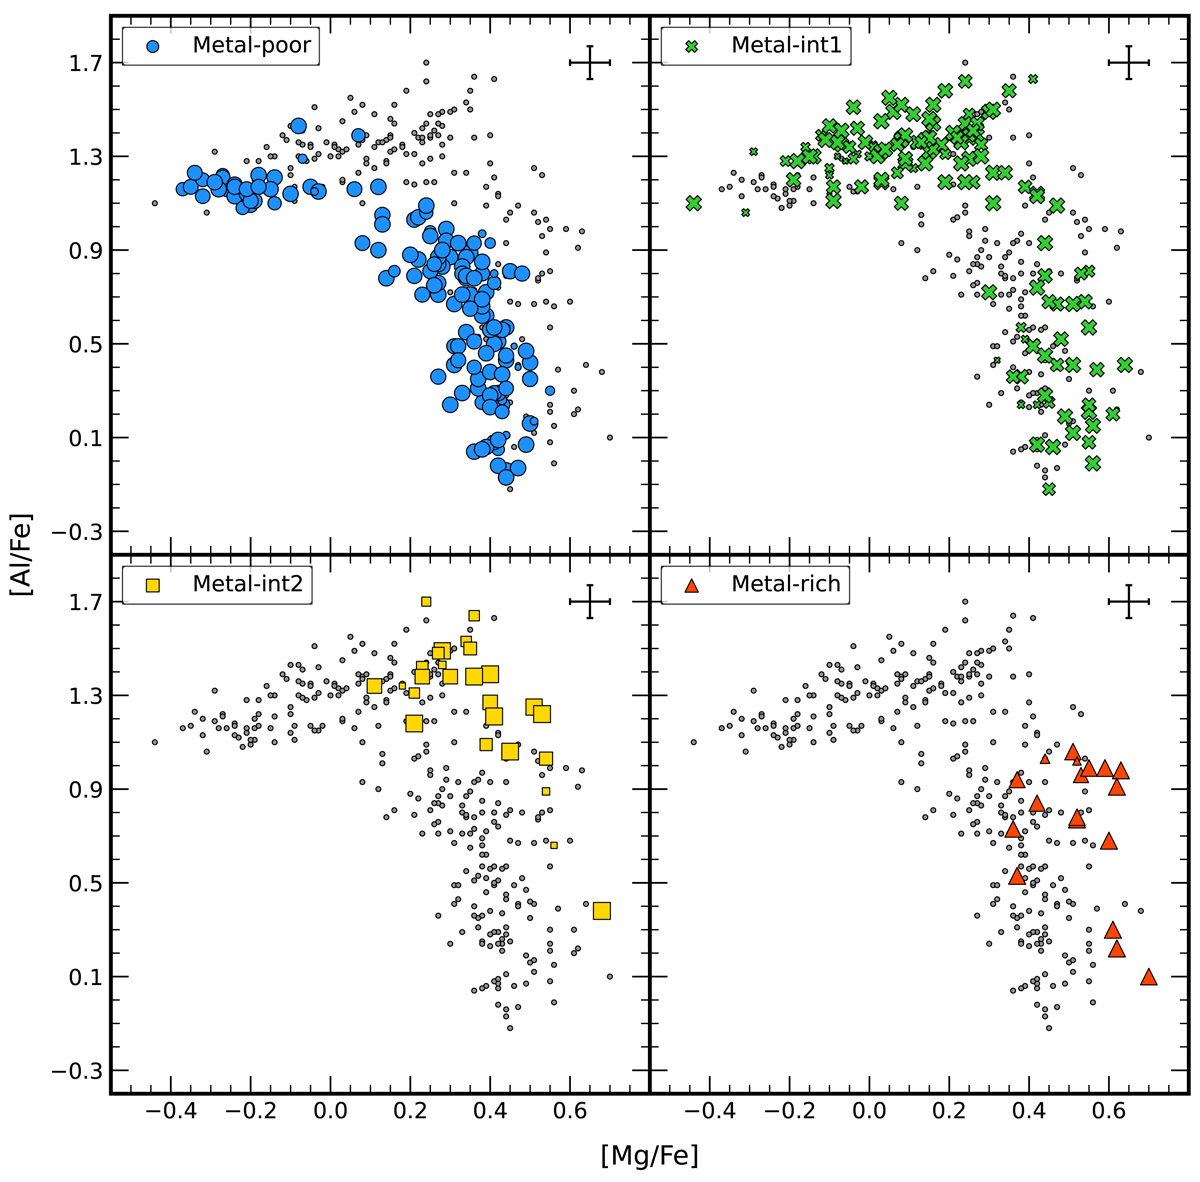
Trend of [Mg/Fe] as a function of [Al/Fe] for the MP, M-int1, M-int2, and MR subpopulations (from top to bottom, left to right). The size of each point indicates its probability of belonging to that particular metallicity subpopulation – the larger the symbol, the higher the probability – while gray dots represent the entire sample. The error bar in the top-right corner represents the typical measurement error associated with the data.
Current usage metrics show cumulative count of Article Views (full-text article views including HTML views, PDF and ePub downloads, according to the available data) and Abstracts Views on Vision4Press platform.
Data correspond to usage on the plateform after 2015. The current usage metrics is available 48-96 hours after online publication and is updated daily on week days.
Initial download of the metrics may take a while.