Fig. 10.
Download original image
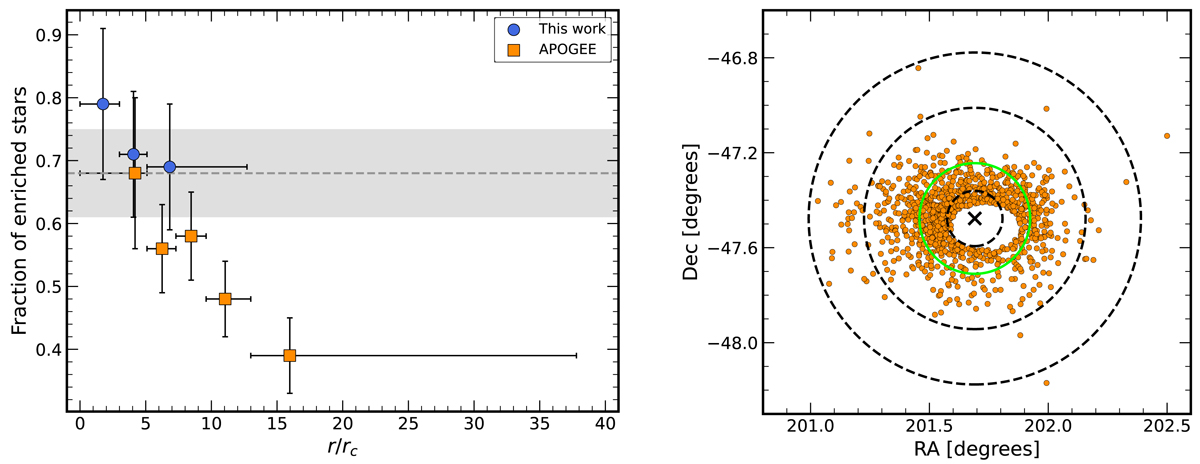
Left panel: fraction of the enriched stars as a function of the distance from the cluster center, as defined by van Leeuwen et al. (2000). The blue circles represent the stars analyzed in this study, whereas the orange squares display the stars studied by Mészáros et al. (2021). In the Y axis, the error bars represent the error associated with the fraction of enriched stars, while in the X axis, they represent the extension of the stars contained in each radial ring. The dashed gray line and the gray area show the mean and the standard deviation for the genuine GCs observed so far, respectively (Bastian & Lardo 2015). Right panel: coordinate positions of stars analyzed by Mészáros et al. (2021). The black cross represents the same cluster center used in Fig. 1. The dashed black circles show 5, 20, and 30 times the core radius (![]() ; Harris 1996). The green circle represents 10 times the core radius and it encloses 554 out of 982 stars.
; Harris 1996). The green circle represents 10 times the core radius and it encloses 554 out of 982 stars.
Current usage metrics show cumulative count of Article Views (full-text article views including HTML views, PDF and ePub downloads, according to the available data) and Abstracts Views on Vision4Press platform.
Data correspond to usage on the plateform after 2015. The current usage metrics is available 48-96 hours after online publication and is updated daily on week days.
Initial download of the metrics may take a while.