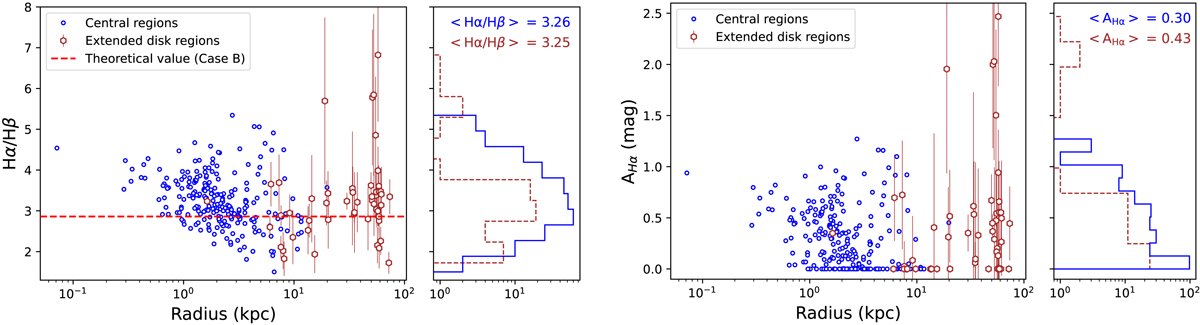
Fig. 4.
Download original image
Radial variation of the Balmer ratio (left panel) and Hα attenuation (right panel). The blue circles and the brown hexagons show the central regions and the extended disk regions, respectively, obtained from the pPXF fit discussed in Sect. 2.2. The horizontal dashed red line marks the intrinsic Balmer ratio of 2.86 for case B recombination. To all regions in which the Balmer ratio was below this value, we assigned zero attenuation. The histograms next to each panel give the overall distribution of each quantity (the solid blue line and the dashed brown line show the central region and extended disk, respectively). Their mean values are indicated at the top of each panel.
Current usage metrics show cumulative count of Article Views (full-text article views including HTML views, PDF and ePub downloads, according to the available data) and Abstracts Views on Vision4Press platform.
Data correspond to usage on the plateform after 2015. The current usage metrics is available 48-96 hours after online publication and is updated daily on week days.
Initial download of the metrics may take a while.