Fig. 3.
Download original image
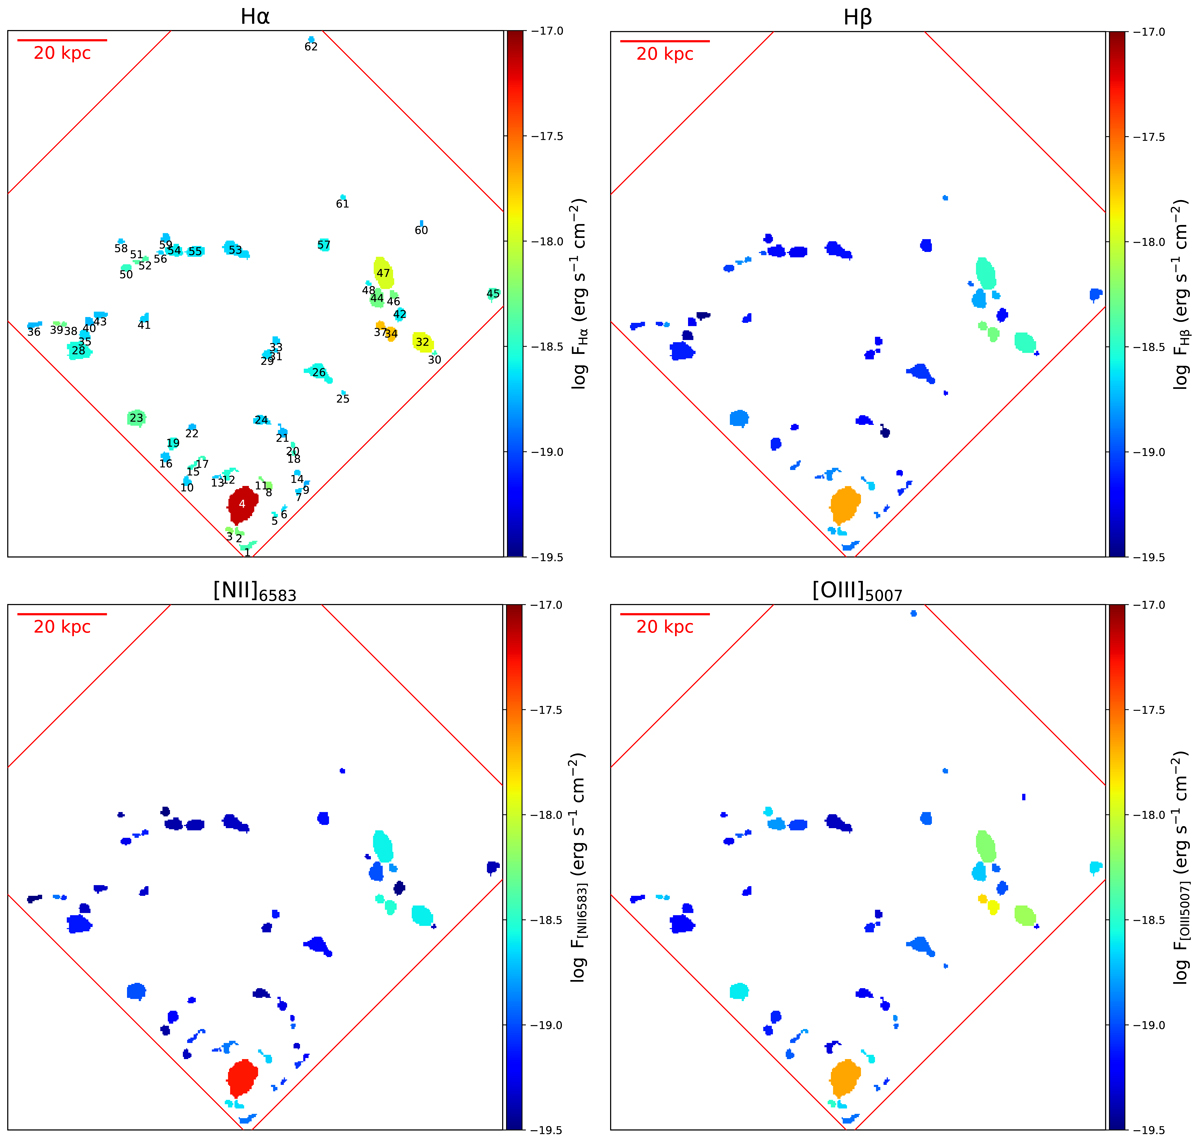
Emission line flux maps of Malin 1 obtained from the pPXF fitting of the H II regions. The Hα, and the Hβ lines are shown in the top panels, and the [N II]6583 and the [O III]5007 lines are shown in the bottom panels. The ID of each region, as discussed in Sect. 2.2.2, is labeled in black in the top left panel. The regions with ID 27 and 49 are excluded from the maps as they do not have an S/N > 2.5 in any of the emission lines. The color bar indicates the flux corresponding to each emission line. The flux value of each region is given as the average flux per pixel within that region obtained from the fitting of its row-stacked spectrum.
Current usage metrics show cumulative count of Article Views (full-text article views including HTML views, PDF and ePub downloads, according to the available data) and Abstracts Views on Vision4Press platform.
Data correspond to usage on the plateform after 2015. The current usage metrics is available 48-96 hours after online publication and is updated daily on week days.
Initial download of the metrics may take a while.