Fig. 4.
Download original image
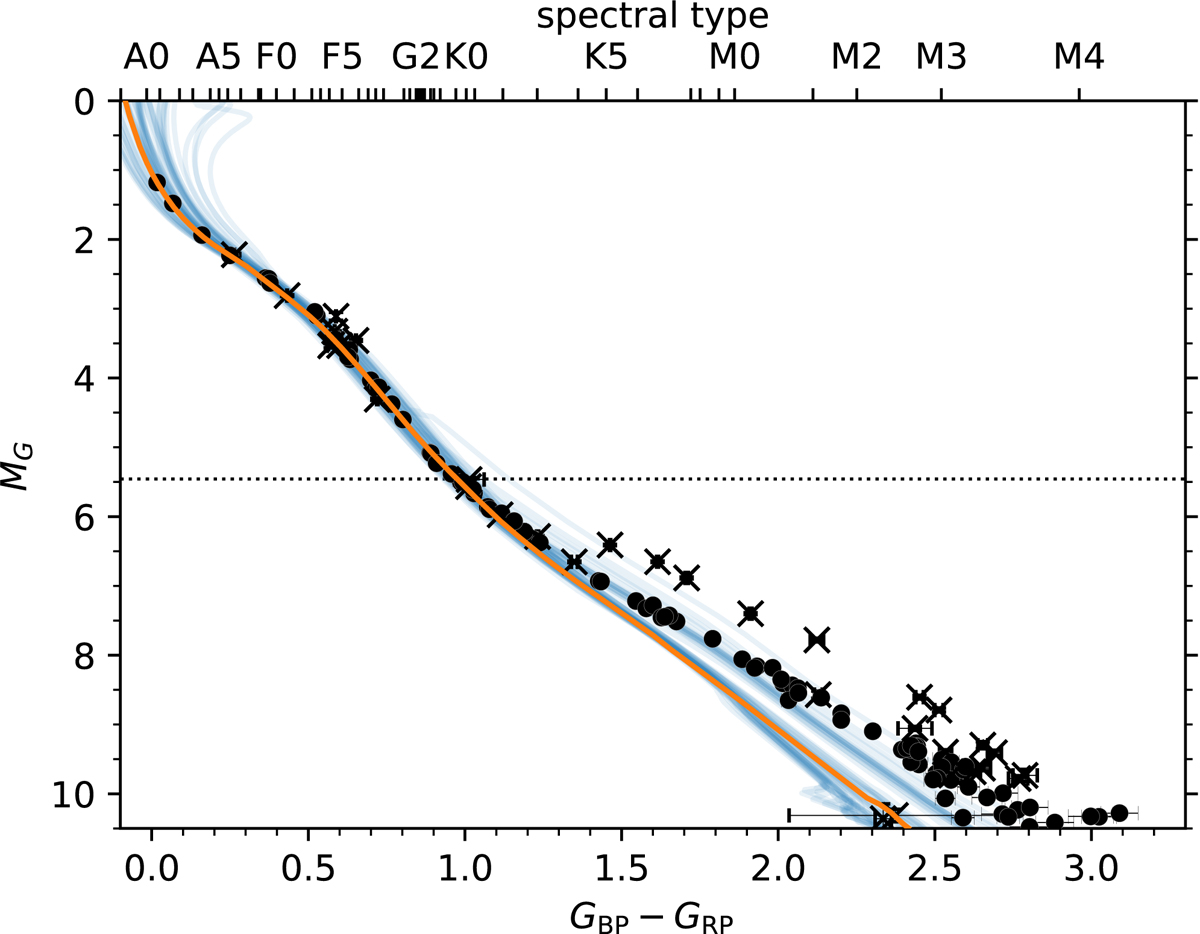
Colour-absolute magnitude diagram of UBC 1 with a selection of reddened rotating MIST isochrones (v/vcrit = 0.5) in blue. The best-fitting isochrone is given in orange and corresponds to the values indicated in Fig. 3. The dotted horizontal line shows the limit used in the fit. The uncertainties are typically within the symbol size. Crosses indicate potential binaries that were omitted from the fit.
Current usage metrics show cumulative count of Article Views (full-text article views including HTML views, PDF and ePub downloads, according to the available data) and Abstracts Views on Vision4Press platform.
Data correspond to usage on the plateform after 2015. The current usage metrics is available 48-96 hours after online publication and is updated daily on week days.
Initial download of the metrics may take a while.