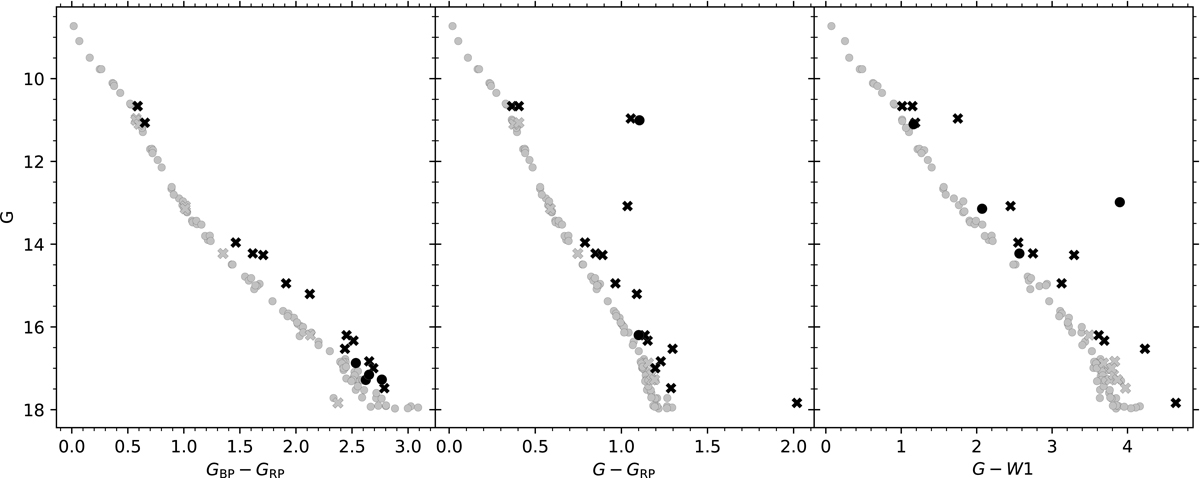
Fig. B.1.
Download original image
Colour-magnitude diagrams used to identify photometric binaries. In each panel, photometric binaries in the respective colour are highlighted. Crosses mark photometric binaries identified also in other colours, while highlighted circles are photometric binaries unique to this colour. Grey circles denote other members. For simplicity, we do not show binaries identified through other means.
Current usage metrics show cumulative count of Article Views (full-text article views including HTML views, PDF and ePub downloads, according to the available data) and Abstracts Views on Vision4Press platform.
Data correspond to usage on the plateform after 2015. The current usage metrics is available 48-96 hours after online publication and is updated daily on week days.
Initial download of the metrics may take a while.