Fig. 8
Download original image
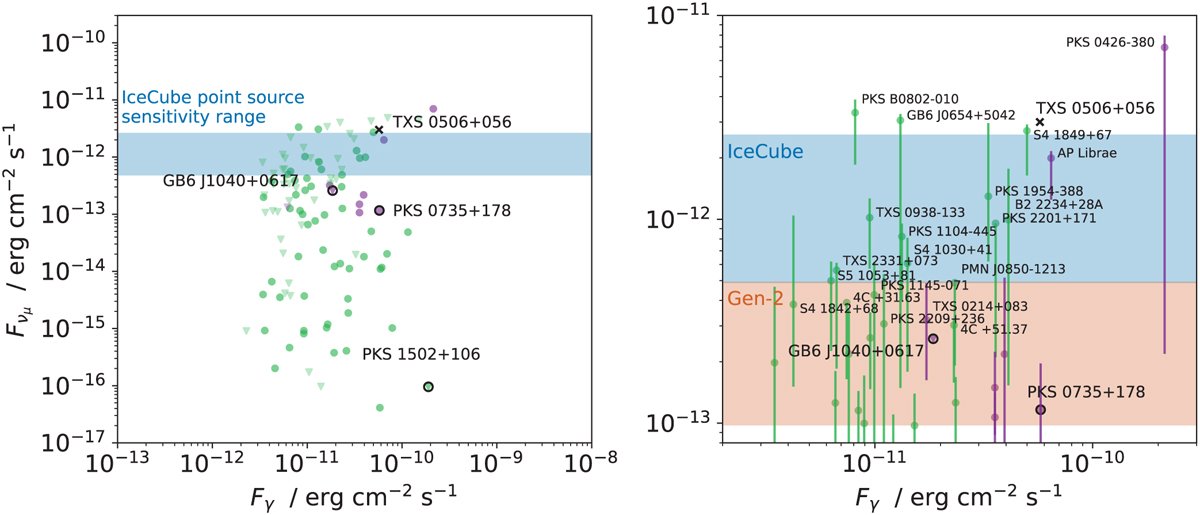
Predicted muon neutrino flux from each source. Here we show only the cases where the neutrino flux is incompatible with zero within the 1σ region from the best fit. Previous neutrino candidates that are part of the sample are highlighted with a black circle and TXS 0506+056, which is not in the sample, is shown as a black cross for comparison. In both plots, we show in blue the IceCube point source sensitivity (Aartsen et al. 2017a); on the right plot, we show additionally the sensitivity band for the future IceCube-Gen2 (Aartsen et al. 2021) and the names of the associated sources with the highest predicted fluxes (cf. Fig. 6).
Current usage metrics show cumulative count of Article Views (full-text article views including HTML views, PDF and ePub downloads, according to the available data) and Abstracts Views on Vision4Press platform.
Data correspond to usage on the plateform after 2015. The current usage metrics is available 48-96 hours after online publication and is updated daily on week days.
Initial download of the metrics may take a while.