Fig. 7
Download original image
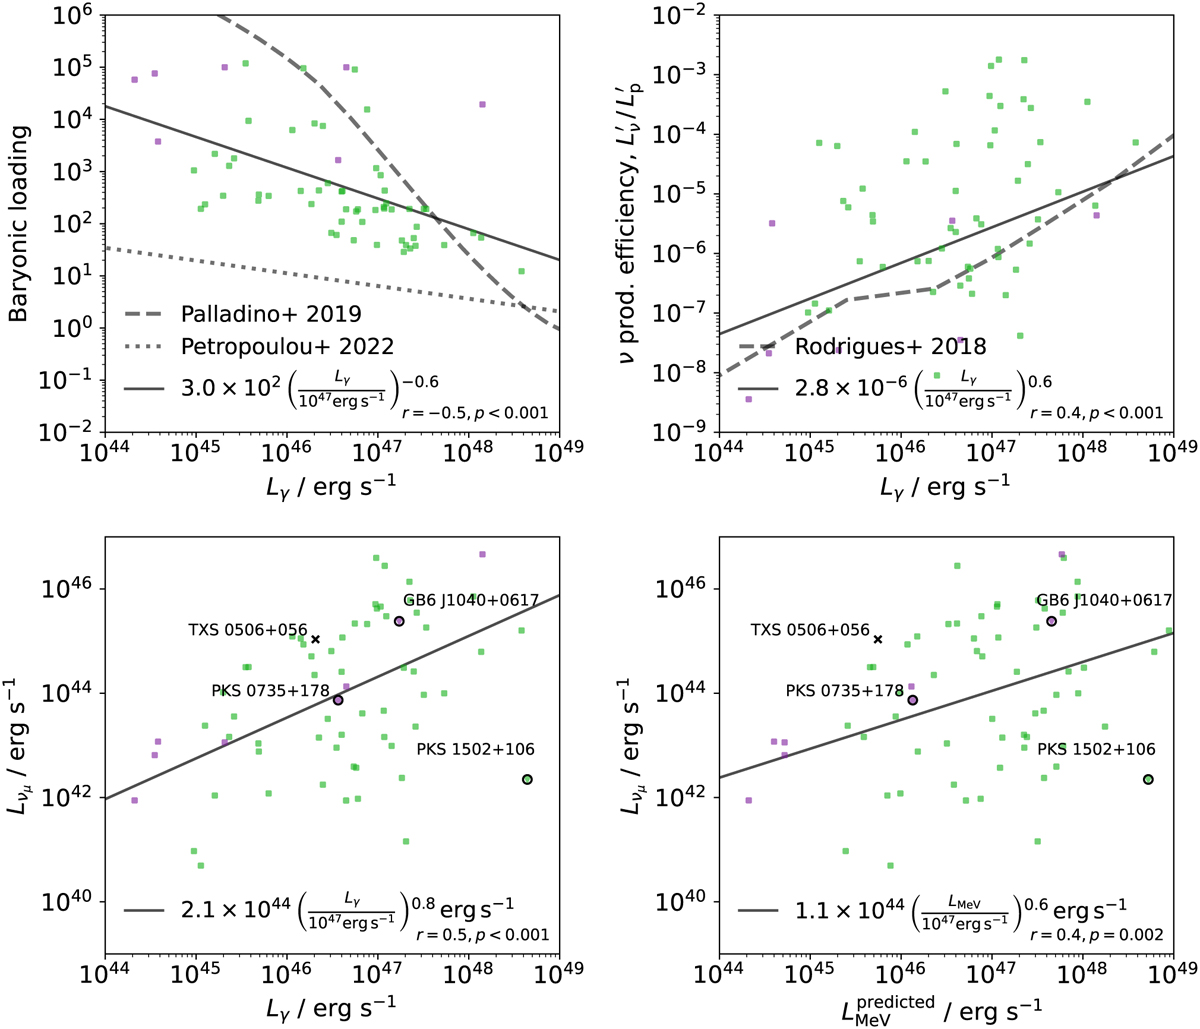
Characterization of the best-fit baryonic loading, neutrino efficiency and predicted neutrino fluxes. Upper panels: distribution of the best- fit baryonic loading (left) and neutrino production efficiency (right) as a function of the source’s gamma-ray luminosity between 100 MeV and 100 GeV. For comparison, in the left-hand-side plots we show the behavior predicted by the magnetically loaded jet model by Petropoulou et al. (2022) and the phenomenological study by Palladino et al. (2019). Lower panels: predicted muon neutrino luminosity for each source as a function of the Fermi LAT luminosity (left) and of the predicted MeV gamma-ray luminosity (right). The color code follows the previous pictures in that FSRQs are shown in green and BL Lacs in purple. The cases where a purely leptonic model lies within 1a of the best-fit result are shown as inverted triangles. The points therefore represent sources for which the data favors leptohadronic model. The solid black lines show the best-fit power law relations. For reference, we show four recent IceCube candidate sources. Of these, only TXS 0506+056 is not contained in this sample, for which we adopt the values from previous studies. For the three other blazars marked, the values of neutrino and MeV gamma-ray luminosity are those predicted by this work.
Current usage metrics show cumulative count of Article Views (full-text article views including HTML views, PDF and ePub downloads, according to the available data) and Abstracts Views on Vision4Press platform.
Data correspond to usage on the plateform after 2015. The current usage metrics is available 48-96 hours after online publication and is updated daily on week days.
Initial download of the metrics may take a while.