Fig. 6
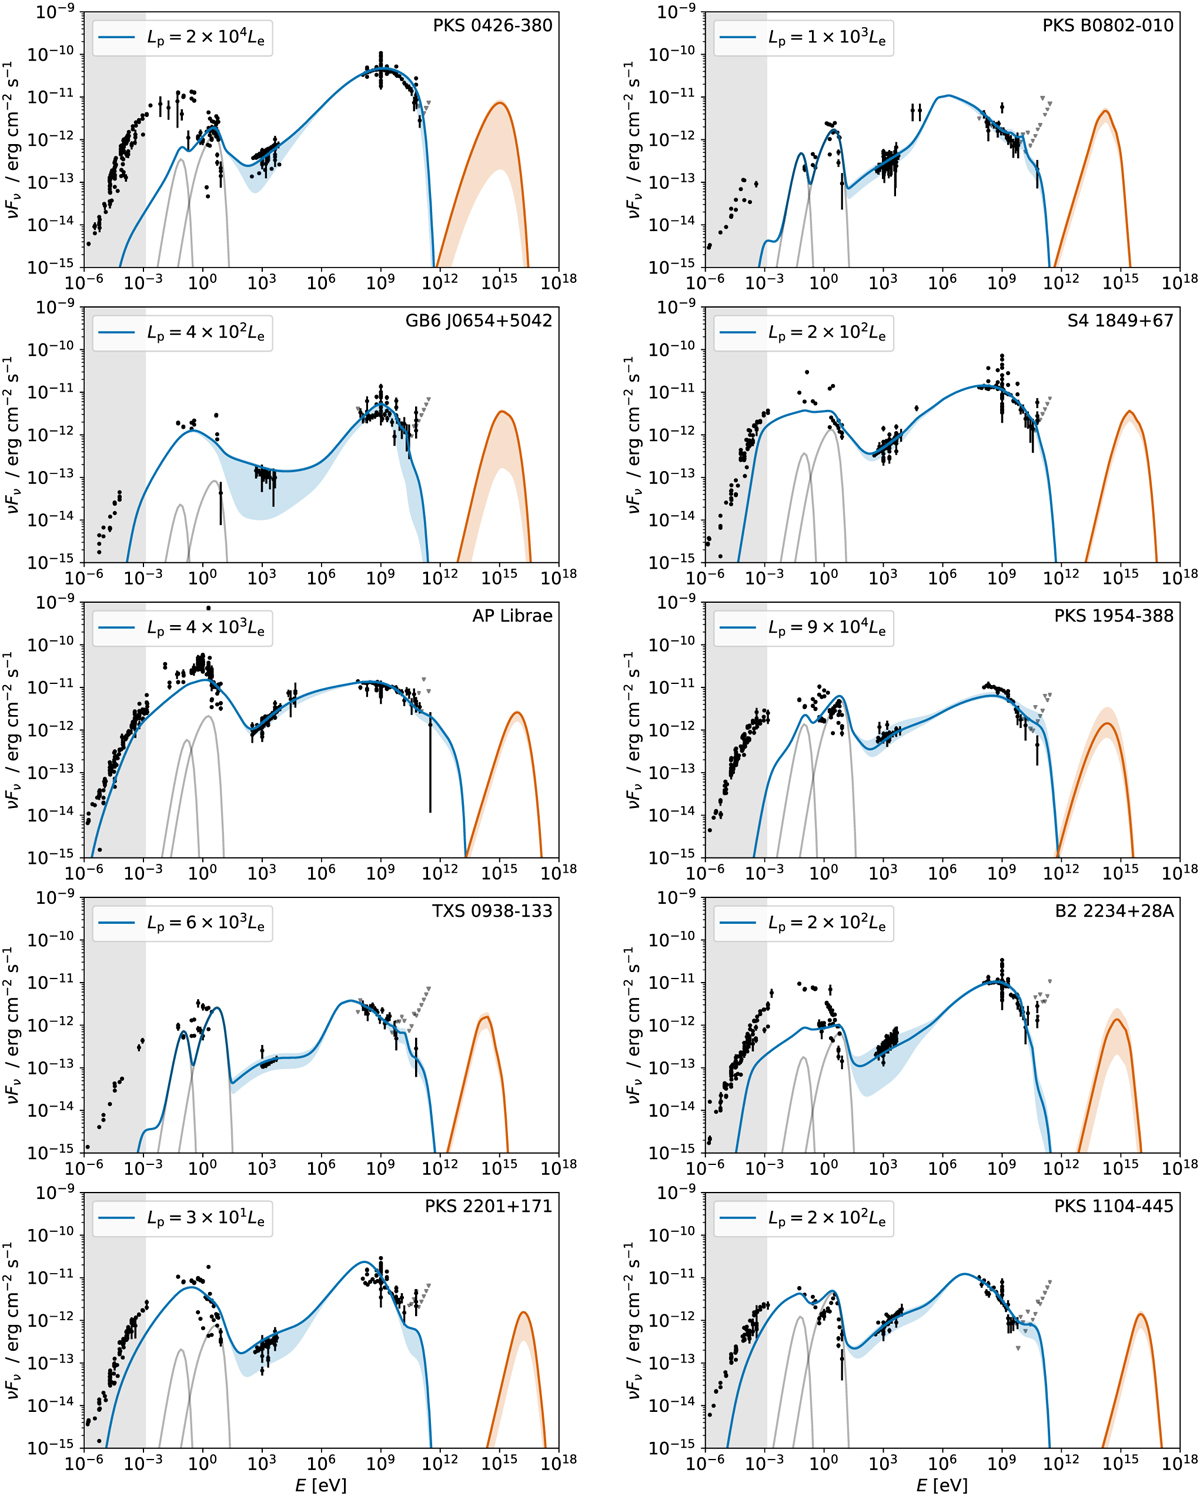
Download original image
Best-fit results of the 10 sources in the sample with the highest predicted neutrino fluxes. The plots are ordered by the value of the total predicted neutrino flux, as in Table B.1, here from left to right and top to bottom. The blue curves show the multiwavelength emission predicted by the full leptohadronic model. The best-fit baryonic loading value is provided in the caption and can also be found in Table B.1). The orange curves on the right-hand side of each panel show the best-fit emitted all-flavor neutrino fluxes, as discussed in Sect. 3.2. The corresponding plot for all modeled sources, as well as the numerical data, can be found in the online repository https://github.com/xrod/lephad-blazars.
Current usage metrics show cumulative count of Article Views (full-text article views including HTML views, PDF and ePub downloads, according to the available data) and Abstracts Views on Vision4Press platform.
Data correspond to usage on the plateform after 2015. The current usage metrics is available 48-96 hours after online publication and is updated daily on week days.
Initial download of the metrics may take a while.