Fig. A.1
Download original image
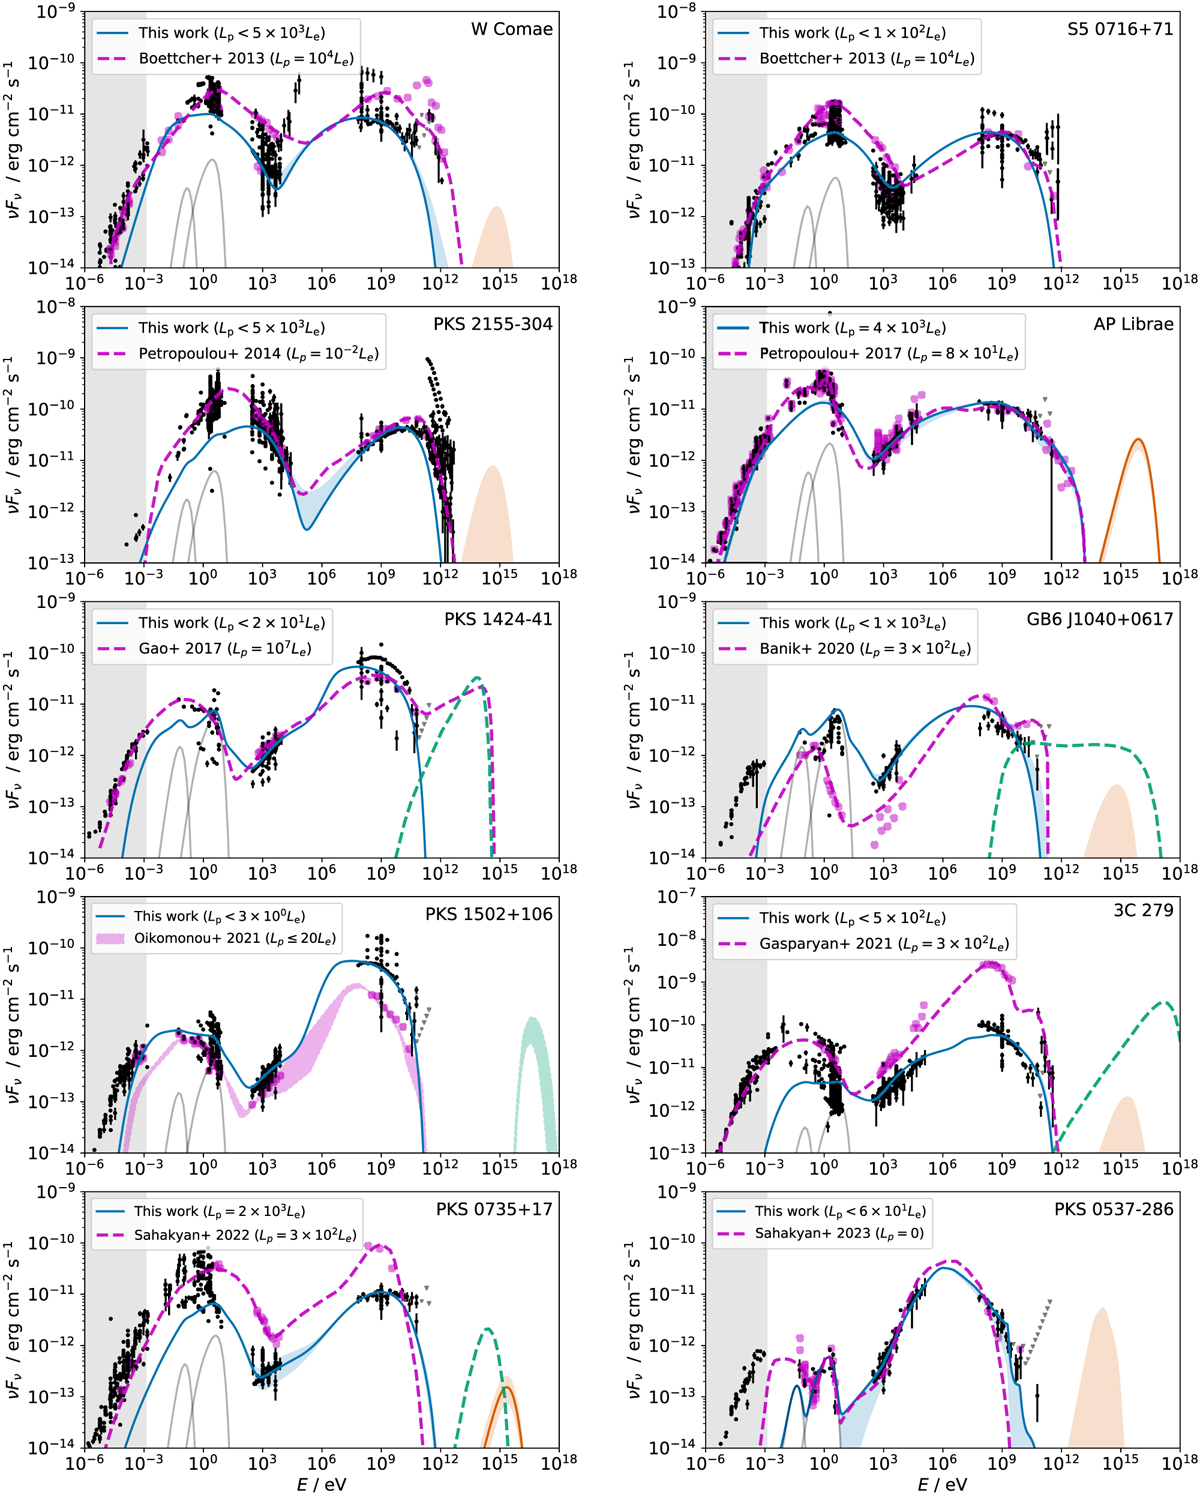
Comparison between the results obtained in this work and ten selected results from recent multiwavelength studies, in chronological order of publication (Boettcher et al. 2013; Petropoulou 2014; Gao et al. 2017; Petropoulou et al. 2017; Banik et al. 2020; Oikonomou et al. 2021; Gasparyan et al. 2021; Sahakyan et al. 2022, 2023). In blue and orange we show respectively the best-fit photon and neutrino fluxes from the current model; the dashed magenta and green curves show the photon and neutrino spectra (when available) predicted by previous works. The magenta points represent the data fitted in the respective study, which in some cases varies significantly from the current work because of time-domain selection. The best-fit baryonic loading values are given in each caption.
Current usage metrics show cumulative count of Article Views (full-text article views including HTML views, PDF and ePub downloads, according to the available data) and Abstracts Views on Vision4Press platform.
Data correspond to usage on the plateform after 2015. The current usage metrics is available 48-96 hours after online publication and is updated daily on week days.
Initial download of the metrics may take a while.