Fig. 11
Download original image
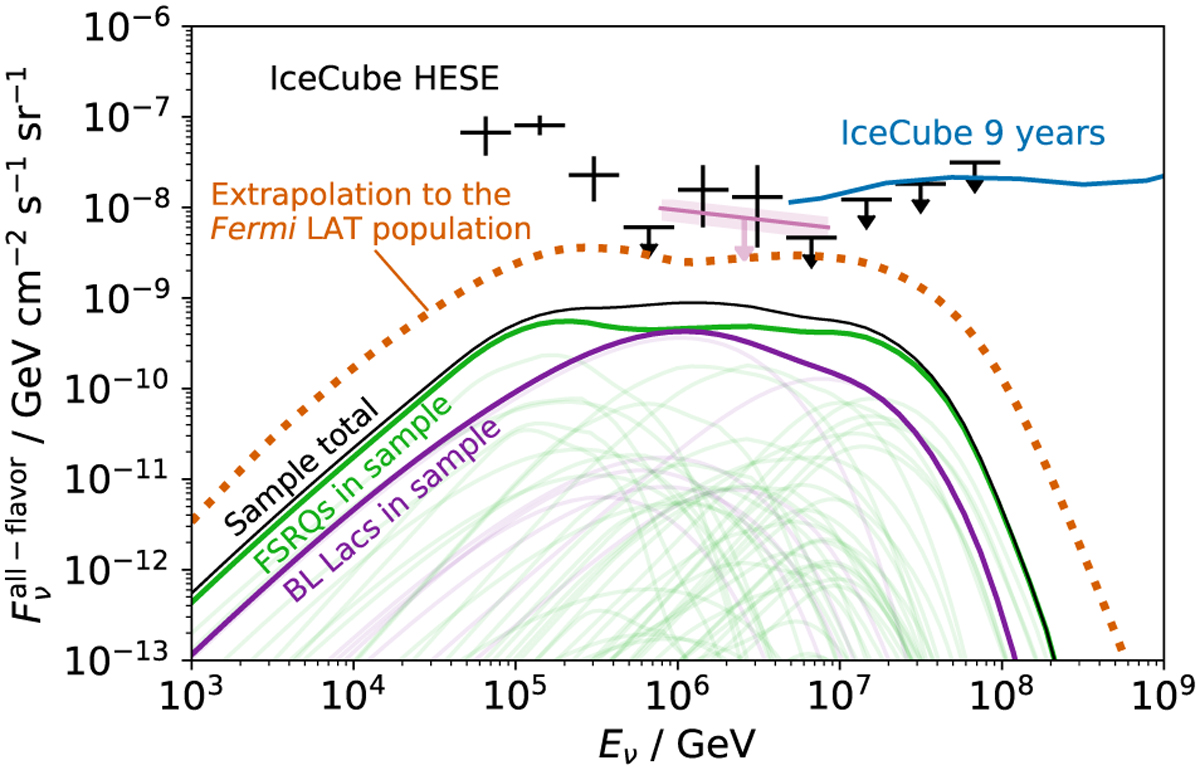
All-flavor neutrino flux expected from the entire sample (solid black curve), separated into FSRQs (solid purple curve) and BL Lacs (solid green curve). Following the sampling method described in the main text, we then extrapolate the result to the entire Fermi-LAT blazar sample and obtain the diffuse spectrum shown as a dotted curve. For visual reference, the individual contributions are represented as thin curves (see also Table B.1). The black data points show IceCube data from the analysis by Aartsen et al. (2015a) and the blue curve shows the 9 yr IceCube sensitivity (Aartsen et al. 2018). In pink, we show the stacking limits derived for blazars by Aartsen et al. (2017b).
Current usage metrics show cumulative count of Article Views (full-text article views including HTML views, PDF and ePub downloads, according to the available data) and Abstracts Views on Vision4Press platform.
Data correspond to usage on the plateform after 2015. The current usage metrics is available 48-96 hours after online publication and is updated daily on week days.
Initial download of the metrics may take a while.