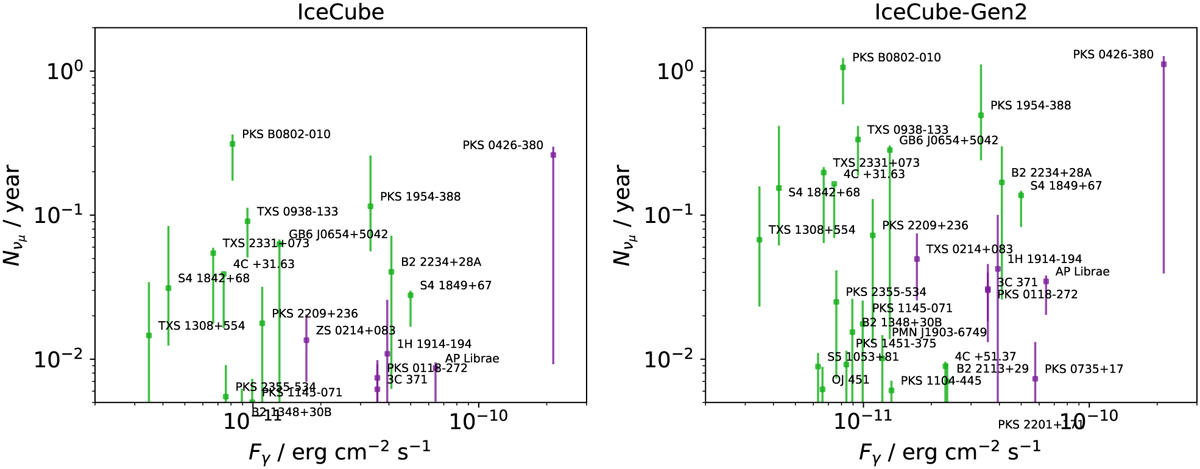
Fig. 10
Download original image
Number of events per year in IceCube (left) and in the future IceCube-Gen2 (right) predicted by the model as function of each source’s gamma-ray flux. Here we include only those sources for which the best-fit result is incompatible with zero baryonic loading within the 1σ region. The name of each associated source is shown for reference (cf. Table B.1). Green points denote FSRQs and purple points denote BL Lacs.
Current usage metrics show cumulative count of Article Views (full-text article views including HTML views, PDF and ePub downloads, according to the available data) and Abstracts Views on Vision4Press platform.
Data correspond to usage on the plateform after 2015. The current usage metrics is available 48-96 hours after online publication and is updated daily on week days.
Initial download of the metrics may take a while.