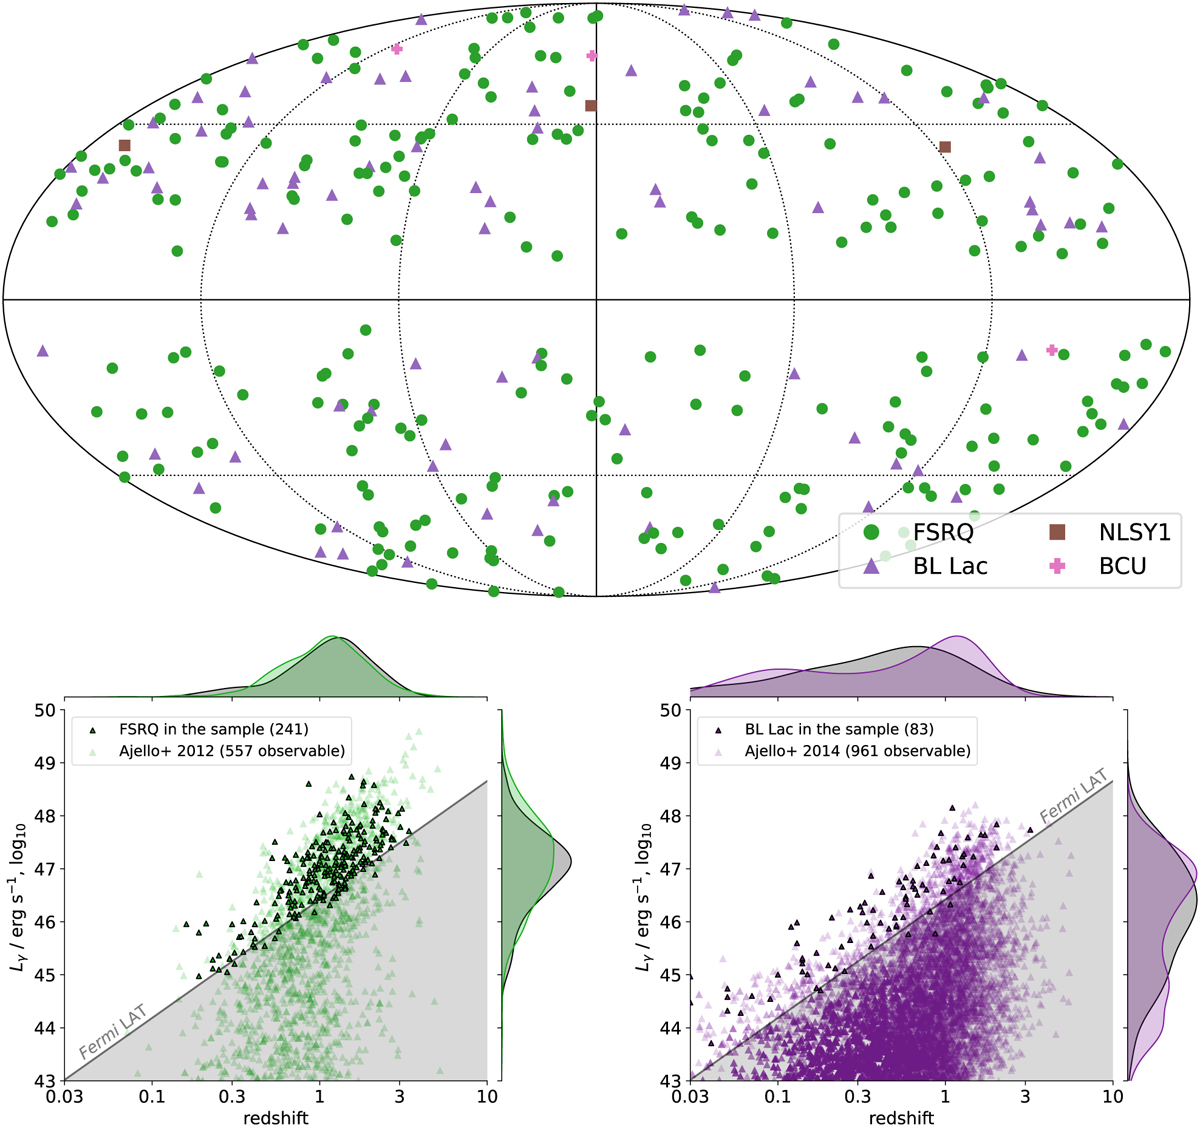
Fig. 1
Download original image
Characterization of the sample. Upper panel: sky map with the positions of the sources studied in this work, which include 237 FSRQs, 88 BL Lacs, three narrow-line Seyferts, and three objects classified as BCUs in the Fermi catalogs. Lower panels: distribution of FSRQs (left) and BL Lacs (right) in the sample as a function of redshift and gamma-ray luminosity (dark points). For comparison, we show as lighter points to the distribution of the respective overall population, based on the luminosity functions by Ajello et al. (2012, 2014). The gray area marks the subthreshold region for the Fermi-LAT. The black distributions alongside the margins refer to the sample; the green (left) and purple (right) distributions refer to the population of sources detected by the Fermi-LAT (i.e., excluding the putative sources below the sensitivity threshold).
Current usage metrics show cumulative count of Article Views (full-text article views including HTML views, PDF and ePub downloads, according to the available data) and Abstracts Views on Vision4Press platform.
Data correspond to usage on the plateform after 2015. The current usage metrics is available 48-96 hours after online publication and is updated daily on week days.
Initial download of the metrics may take a while.